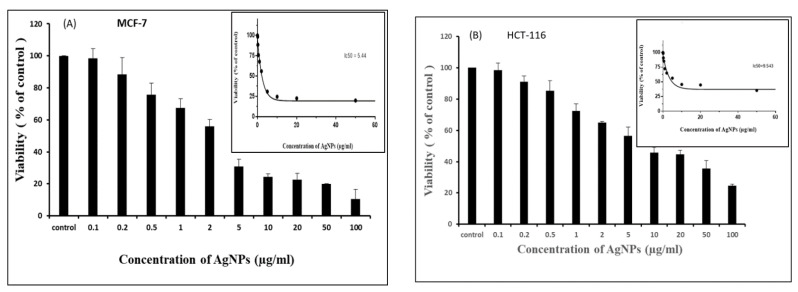
Figure 3.
Cell viability measurement by MTT-based colorimetric method. Cells were treated with different concentrations of AgNPs for 24 h. The results represent the means of three separate experiments for each MCF-7 (A) and HCT-116 (B) cell lines and error bars represent the standard error of the mean. Treated groups showed statistically significant differences from the control group by ANOVA (p < 0.05). IC50 values were measured by prism software (Inset).

