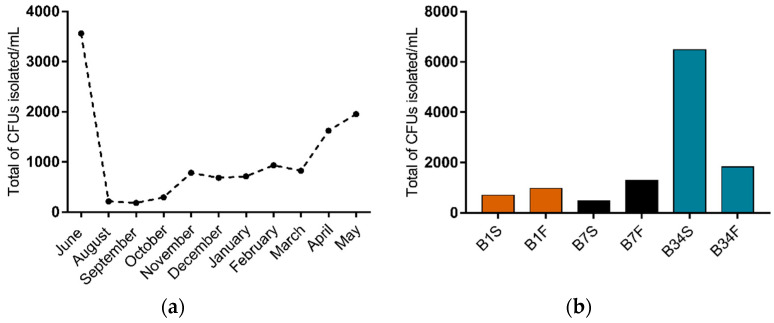
Figure 1.
Distribution of CFU isolated on TCBS agar from Guanabara Bay’s waters over the course of one year. (a) Distribution of total CFU/mL isolated in each sampling expedition from June/2018 to May/2019. (b) CFU/mL isolated in each sampling site, from the subsurface as well as from the bottom water samples. B1S: site 1 subsurface; B1F: site 1 bottom; B7S: site 7 subsurface; B7F: site 7 bottom; B34S: site 34 subsurface; B34F: site 34 bottom.

