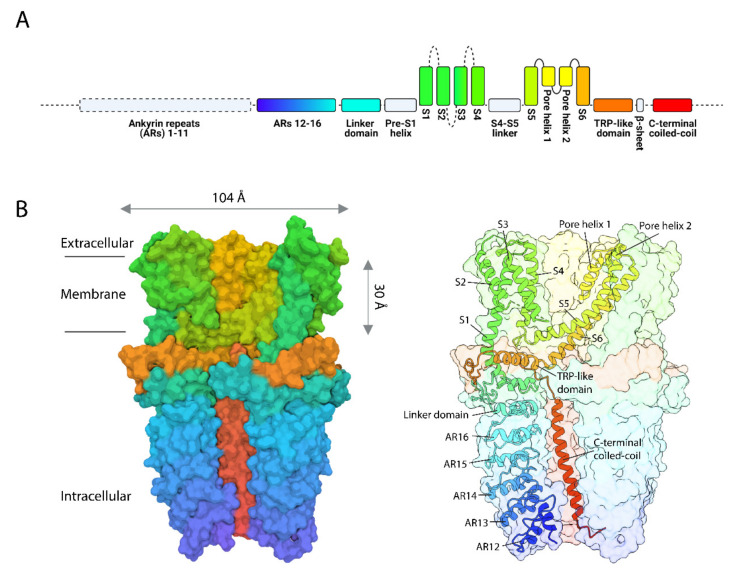
Figure 1.
Human TRPA1 structure and 3D reconstruction. (A) Major structural domains of hTRPA1 color-coded blue at N-terminus to red at C-terminus. Dashed lines and boxes denote regions in which cryo-EM density was insufficient to resolve structural details, or where definitive assignment of specific residues was not possible. Solid gray boxes indicate structural regions not annotated in (B). (B) 3D cryo-EM density map of TRPA1 (left; PDB entry 3j9p) and ribbon diagram of a TRPA1 subunit (right) color-matched to linear diagram in (A). Figure adapted from [22] (reprinted by permission from Springer Nature: Nature, Copyright 2015) and generated in part with UCSF ChimeraX [40].

