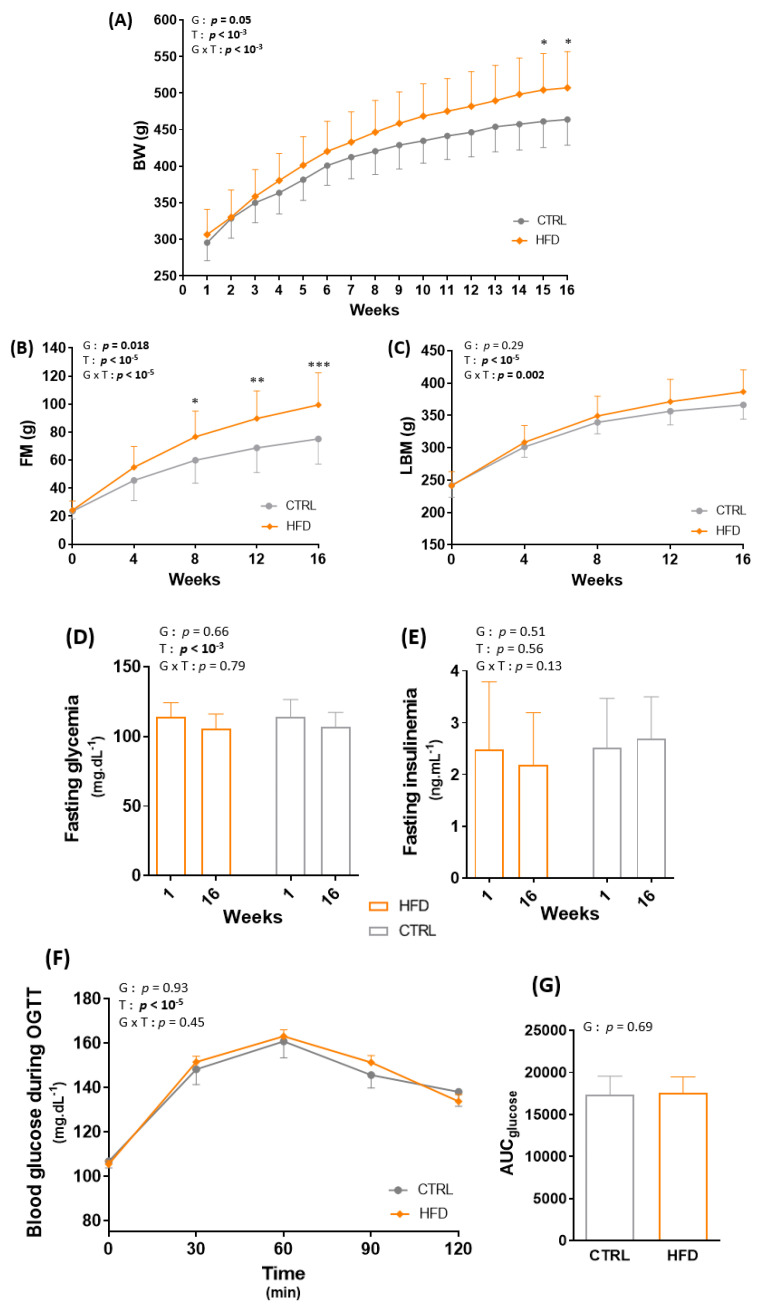
Figure 2.
Effect of obesity induction on body weight (BW) (A), total fat mass (FM) (B), total lean body mass (LBM) (C), fasting glycemia (D), fasting insulinemia (E), blood glucose during the oral glucose tolerance test (OGTT) (F) and total area under the curve of glucose (AUCglucose) (G). * p < 0.05, ** p < 0.005, *** p < 0.0005, G: group effect, T: time effect, G × T: group × time effect. CTRL: control group, HFD: high-fat diet.

