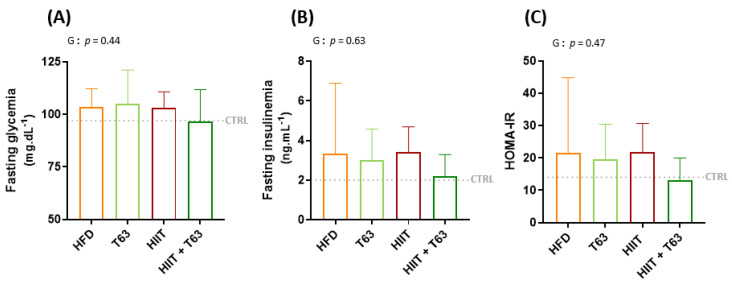
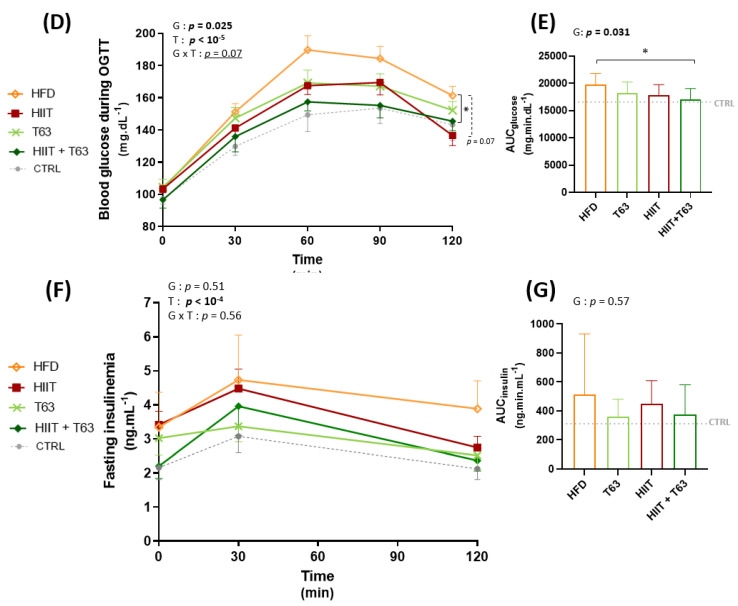
Figure 4.
Effects of T63 supplementation and/or HIIT on (i) Fasting glycemia (A), Fasting insulinemia (B), and HOMA-IR (C) and on (ii) blood glucose (D,E), and insulin (F,G) levels during the oral glucose tolerance test (OGTT). * p < 0.05. AUC: area under the curve, G: group effect, T: time effect, G × T: group × time effect.


