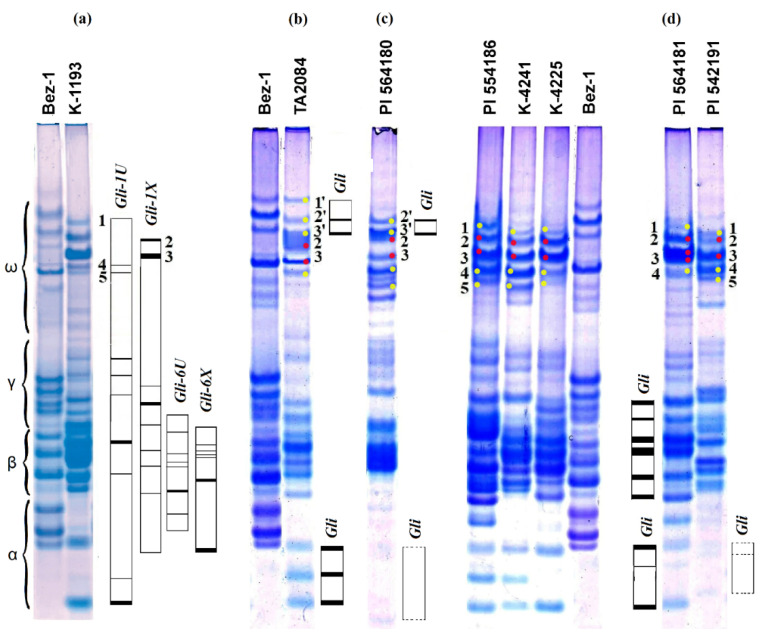
Figure 9.
Ae. columnaris with the most distinct gliadin spectra: (a) gliadin spectrum of a model Ae. columnaris accession K−1193 in comparison with etalon spectrum of wheat cultivar Bezostaya−1 (Bez−1). Blocks of linked electrophoretic gliadin components controlled by a single locus of the particular Ae. columnaris chromosome [27] are shown schematically at the right side of the electrophoretic spectrum; (b) EP spectrum of the accession TA2084 in comparison with wheat cultivar Bezostaya−1; (c) EP spectrum of PI 564180; (d) EP spectra of Ae. columnaris accessions illustrating protein components presumably encoded by the Xc (red dots) and Uc (yellow dots) chromosomes. The unique components, which were not found in any other Ae. columnaris accessions, are shown schematically (parts (b–d)).

