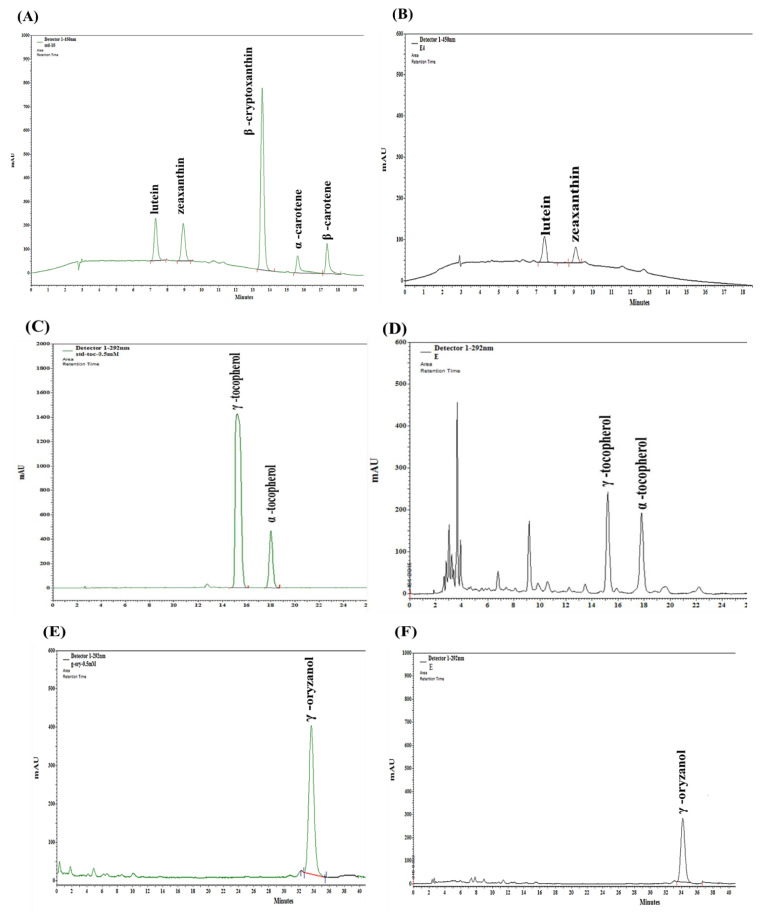
Figure 3.
Representative HPLC chromatograms of bioactive compounds. (A) A standard mixture of all the analyzed carotenoids at λ = 450 nm. (C) A standard mixture of tocopherols at λ = 292 nm. (E) A standard mixture of γ-oryzanol at λ = 325 nm. (B,D,F) are representative chromatograms (ethanol extract) of carotenoids, tocopherols, and γ-oryzanol, respectively.

