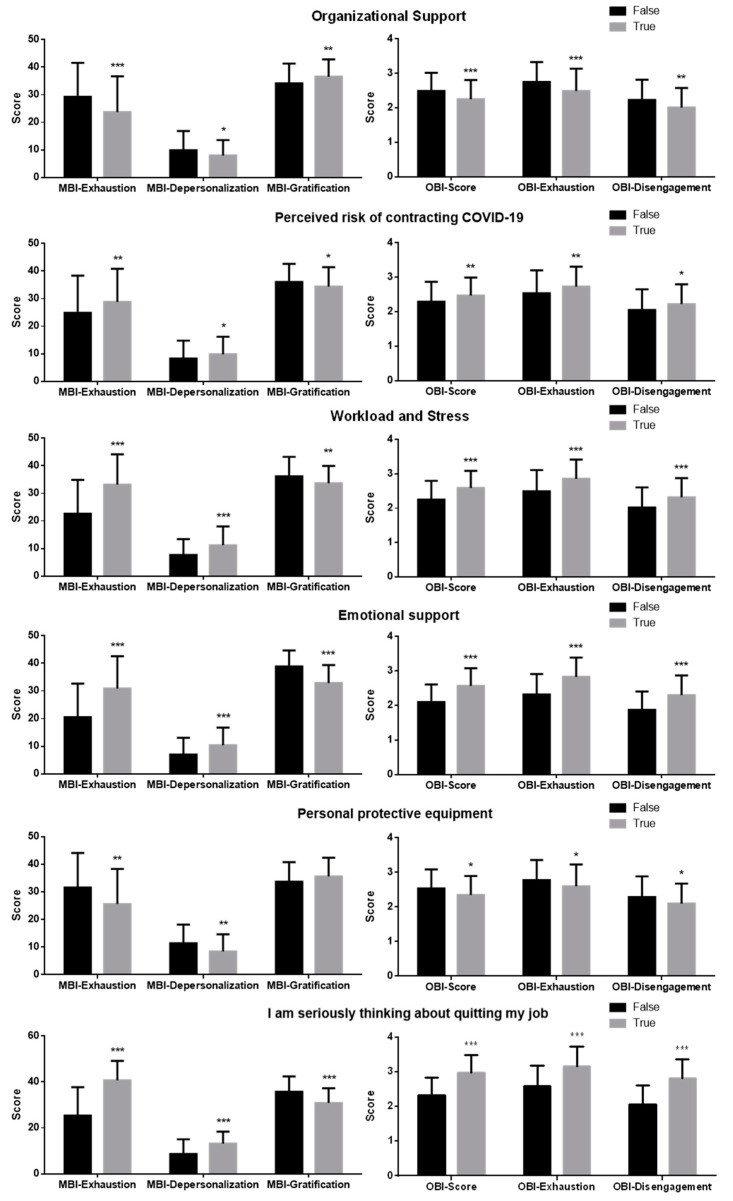
Figure 1.
Comparison of scores obtained by the Maslach Burnout Inventory (MBI) and the Oldenburg Burnout Inventory (OBI) in participants grouped according to the working factors reported in the graph titles. Data are expressed as mean ± standard deviation. Statistical differences were assessed by independent student’s t-test. * = p < 0.05; ** = p < 0.01; *** = p < 0.001.

