Figure 1.
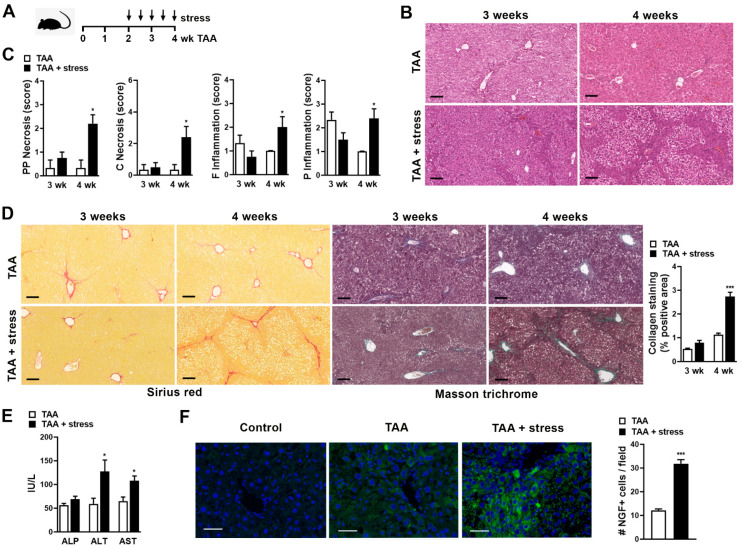
(A) Experimental murine model: Thioacetamide (TAA) was administered for 3 or 4 weeks (wk) to induce fibrosis and stress stimulus was performed by exposition to sound stress for the duration of 24 h starting on week 2 of TAA administration, twice a week. (B) Representative images of H&E staining at 3 and 4 weeks with fibrosis (TAA) or fibrosis with stress (TAA + stress). Bar = 100 µm. (C) Score of periportal and periseptal (PP) necrosis, confluent (C) necrosis, focal (F) inflammation, and portal (P) inflammation in livers at 3 or 4 weeks (wk) of fibrosis (TAA) or fibrosis with stress (TAA + stress). Results are expressed as mean score ± S.E.M. * p < 0.05 vs. TAA (Kruskal–Wallis test). (D) Representative images of Sirius red and Masson’s trichrome staining on liver sections. Bar = 100 µm. Quantification of collagen deposits based on Sirius red-stained sections was performed by morphometric analysis and % positive area ± S.E.M was depicted. *** p < 0.001 vs. TAA (Kruskal–Wallis test). (E) Alkaline phosphatase (ALP), aspartate transaminase (AST), and alanine aminotransferase (ALT) were measured in serum. * p < 0.05 vs. TAA (Mann–Whitney test). (F) Representative images and NGF expression in liver as number of NGF+ cells/field ± S.E.M is shown. Negative immunofluorescence control without NGF antibody is also shown (control). Bar = 50 µm. *** p < 0.001 vs. TAA (Mann–Whitney test).

