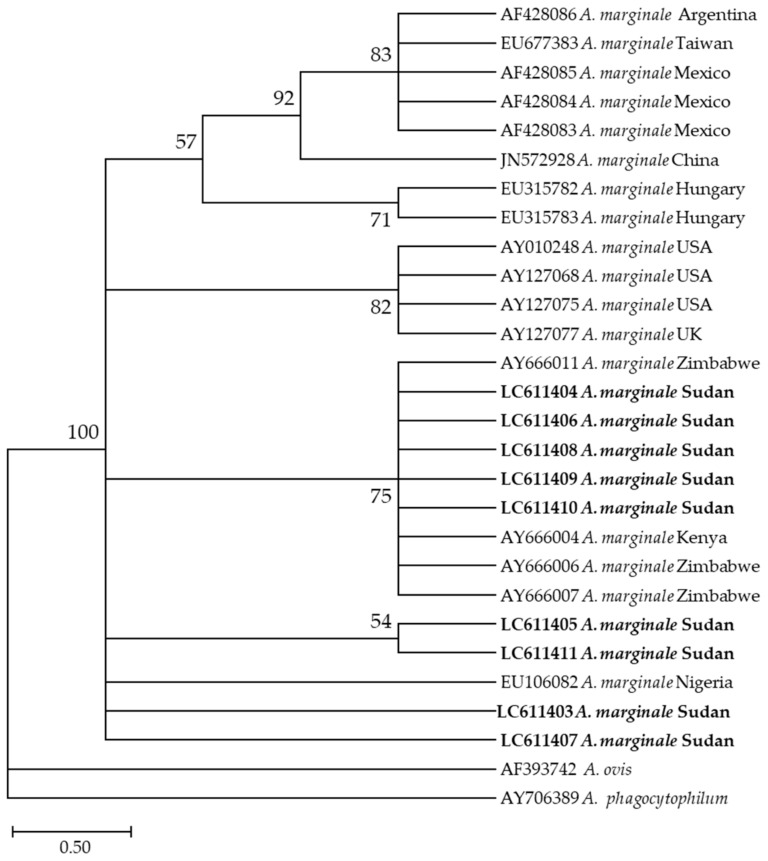
Figure 4.
Phylogenetic analysis of Anaplasma marginale identified in this study based on msp4 gene sequences using the maximum likelihood method. The number at the nodes represents the percentage occurrence of clade in a 1000 bootstrap replication of data. The best model was the Tamura 2-parameter model with invariant sites. Sequences from this study are shown in bold font. The tree was constructed using the MEGA version X software program.

