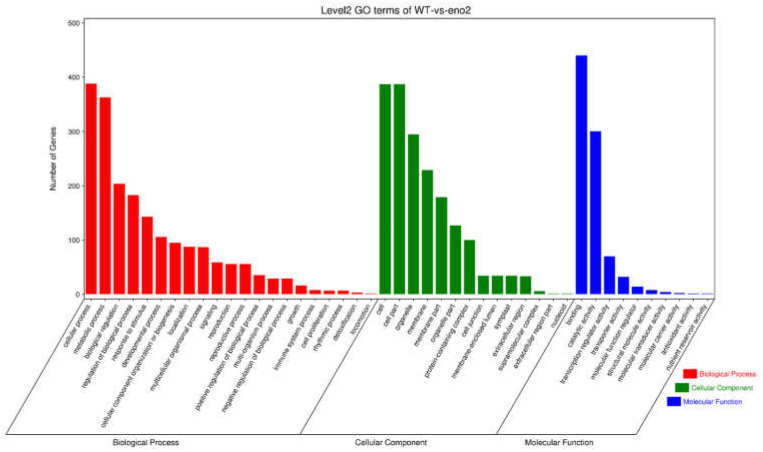
Figure 6.
GO term classification for DEMs target genes in WT and eno2−. The X-axis showed GO terms, and Y-axis meant the number of genes. The red bar charts represented the biological process, the green bar charts indicated the molecular function and the blue bar charts represented the cellular component.

