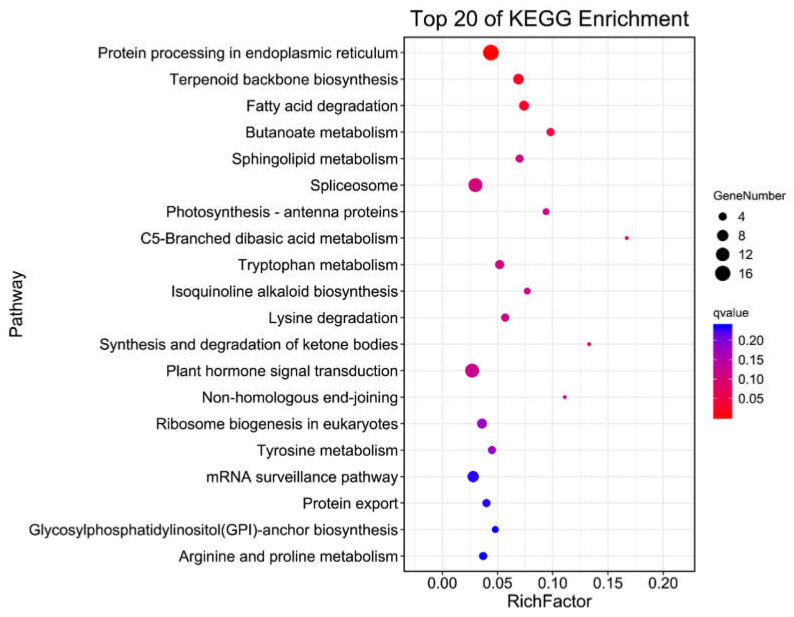
Figure 7.
KEGG pathways analysis of DEMs target genes in WT and eno2−(TOP 20). Q-value represented enrichment degree, blue to red colors indicated decreasing values. The smaller the q-value, the more significant the enrichment. The size of the circle showed the amount of enrichment, and the bigger the circle size, the more genes enriched in the related pathways.

