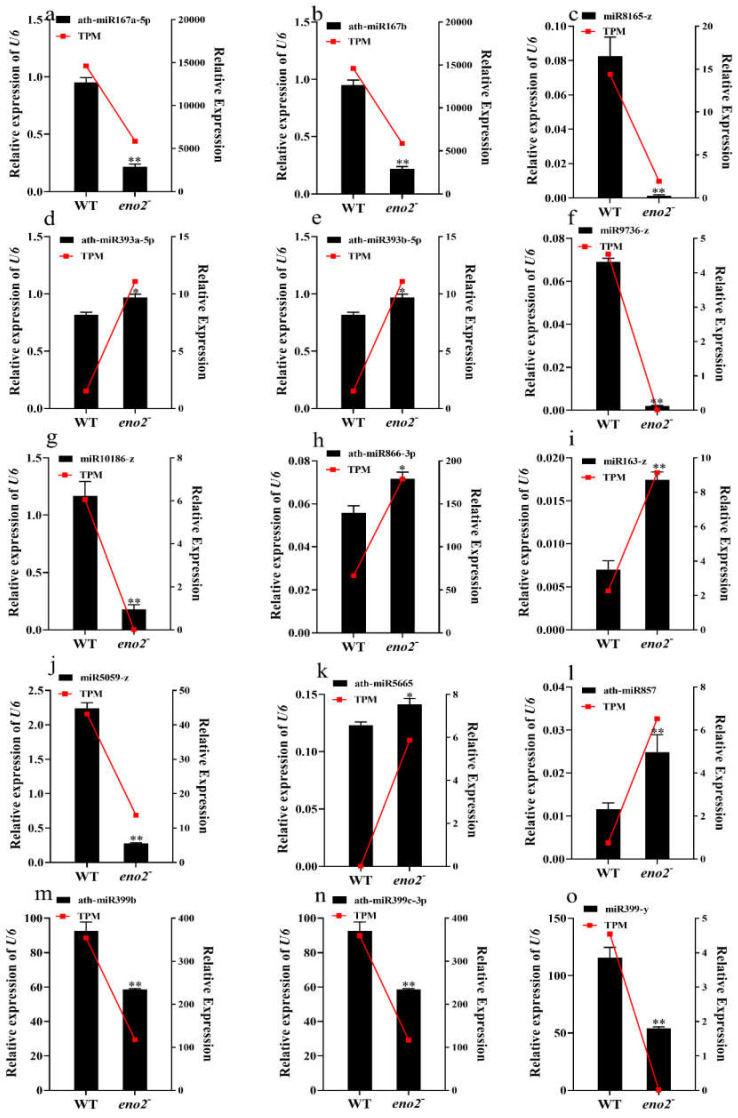
Figure 8.
qRT-PCR validation of 15 miRNAs: (a–o) Represented different miRNAs expression levels with deep sequencing and qRT-PCR. The TPM value was taken as the relative expression level of deep sequencing miRNAs, which was shown as the red line, corresponding to the Y-axis on the right side. The qRT-PCR validation used the black bar chart, corresponding to the Y-axis on the left side, and U6 was used for each sample as an endogenous control. Three independent biologicals and three technical replicates were employed; the error bars show the SD (standard deviations). The significant difference was compared using the Student’s t-test. * p ≤0.05; ** p ≤ 0.01.

