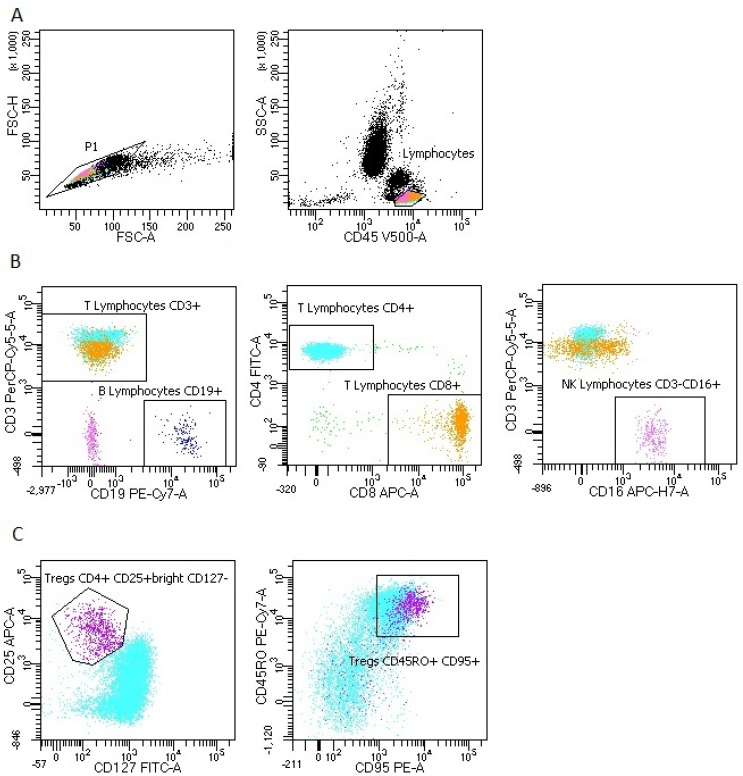
Figure A2.
Representative FACS analysis of PB cells with antibodies specific for lymphocytes subpopulations and T regulatory (Treg) cells. (A) Lymphocytes gating strategy: FSC-A vs. FSC-H plot: Gating the cells that have an equal area and height, thus removing clumps (greater FSC-A relative to FSC-H) and debris (very low FSC), CD45 vs. SSC-A plot: Selection of lymphocytes based on their SSC/CD45+ properties. (B) Lymphocyte subpopulation gating strategy: CD3 vs. CD19 plot: Selection of lymphocytes T (blue and yellow) based on their CD3+ properties and lymphocytes B (navy blue) based on their CD19+ properties. CD4 vs. CD8 plot: Selection of T lymphocytes subsets CD4+ (blue) and CD8+ (yellow) based on their CD4/CD8 properties. CD3 vs. CD16 plot: Selection of NK cells (pink) based on their CD16+ properties and CD3 negative. (C) Treg cells and Tregs subsets gating strategy: CD25 vs. CD127 plot: Selection of Treg cells (purple) based on their CD25+high and CD127 negative properties. CD45RO vs. CD95 plot: Treg cells subset with CD45RO and CD95 expression.

