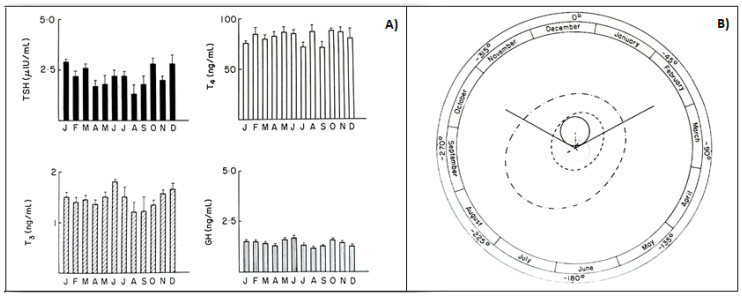
Figure 5.
(A) Monthly mean (±SD) of TSH, T4, T3, GH values in prepubertal subjects. (B) Single cosinor display of circannual variations in these hormone concentrations and their characteristics, visualized by polar cosinor plot. A significant rhythm was validated only for TSH, as revealed by its ellipse (continuous tract), which does not cover the pole (zero: center), and with acrophase in December, as indicated by the arrow starting from the center and directed towards December (confidence limits October–February) [68].

