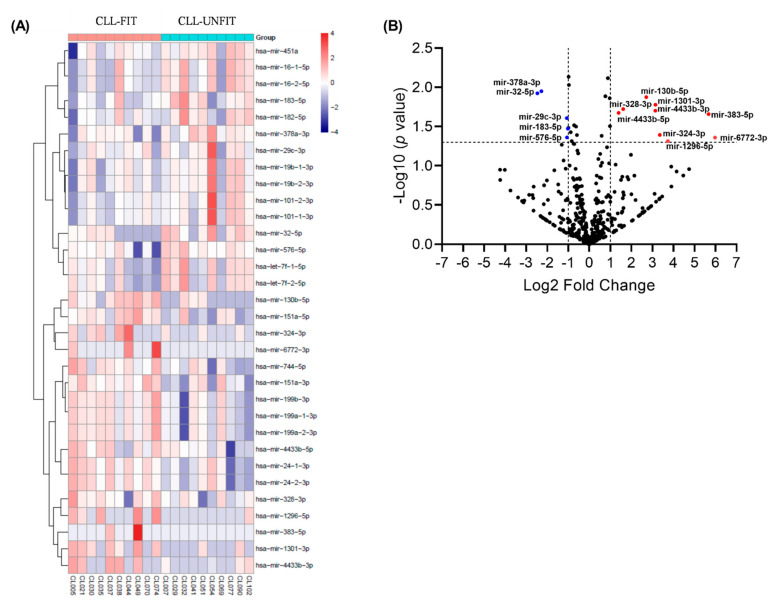
Figure 2.
Differential expression of plasma exosomal miRNAs between CLL-FIT and CLL-UNFIT. (A) Heat map with a dendrogram illustrating the correlation distance with complete linkage hierarchal clustering for the 32-exosomal miRNAs differentially expressed when comparing CLL-FIT to CLL-UNFIT. Values represent the z-score normalized miRNA counts per million reads. Colors represent the level of miRNA expression, with dark red being the highest expression and dark blue the lowest expression. (B) Volcano plot of differentially expressed miRNAs in CLL-FIT vs. CLL-UNFIT. The p-value in the −log10 scale is plotted against the log2 fold change for each miRNA, with each circle denoting an individual miRNA. The miRNAs with Wald Test p-values ≤ 0.05 and log2 fold changes ≥1 or ≤−1 are represented by red circles (higher expression in CLL-FIT) or blue circles (higher expression in CLL-UNFIT). Nine exosomal miRNAs were higher and five were lower in the CLL-FIT compared to CLL-UNFIT group.

