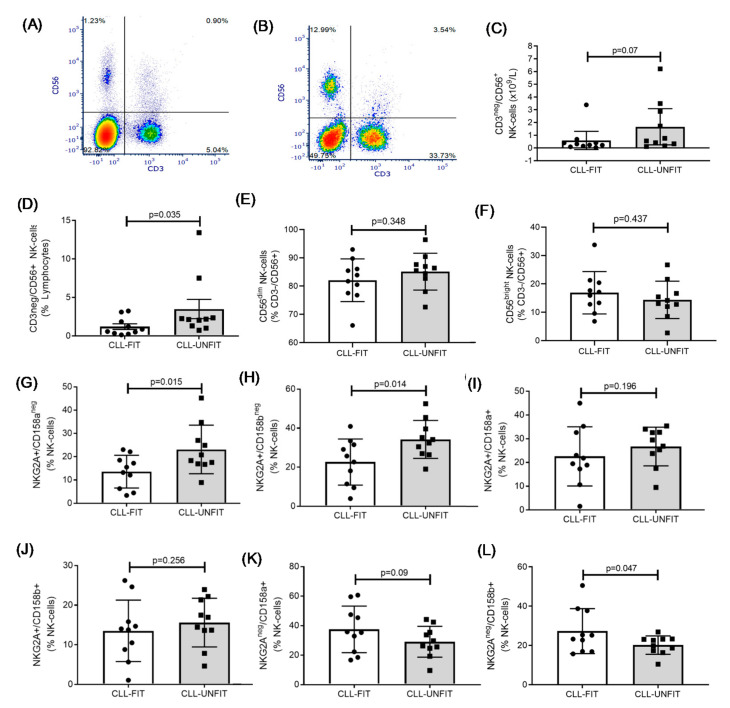
Figure 3.
NK cell similarities and differences between CLL-FIT and CLL-UNFIT. Representative flow cytometry plots of CD3 vs. CD56 lymphocytes for (A) CLL-FIT and (B) CLL-UNFIT. (C) Absolute numbers of CD3neg/CD56+ NK cells. (D) Percentage of lymphocytes that are CD3neg/CD56+ NK cells. (E) Frequency of CD56dim NK cells within the NK cell population. (F) Frequency of CD56bright NK cells within the NK cell population. (G) Frequency of least-differentiated NKG2A+/CD158aneg NK cells. (H) Frequency of least-differentiated NKG2A+/CD158bneg NK cells. (I) Frequency of medium-differentiated NKG2A+/CD158a+ NK cells. (J) Frequency of medium-differentiated NKG2A+/CD158b+ NK cells. (K) Frequency of most-differentiated NKG2Aneg/CD158a+ NK cells. (L) Frequency of most-differentiated NKG2Aneg/CD158b+ NK cells. Data are the mean and 95% CI.

