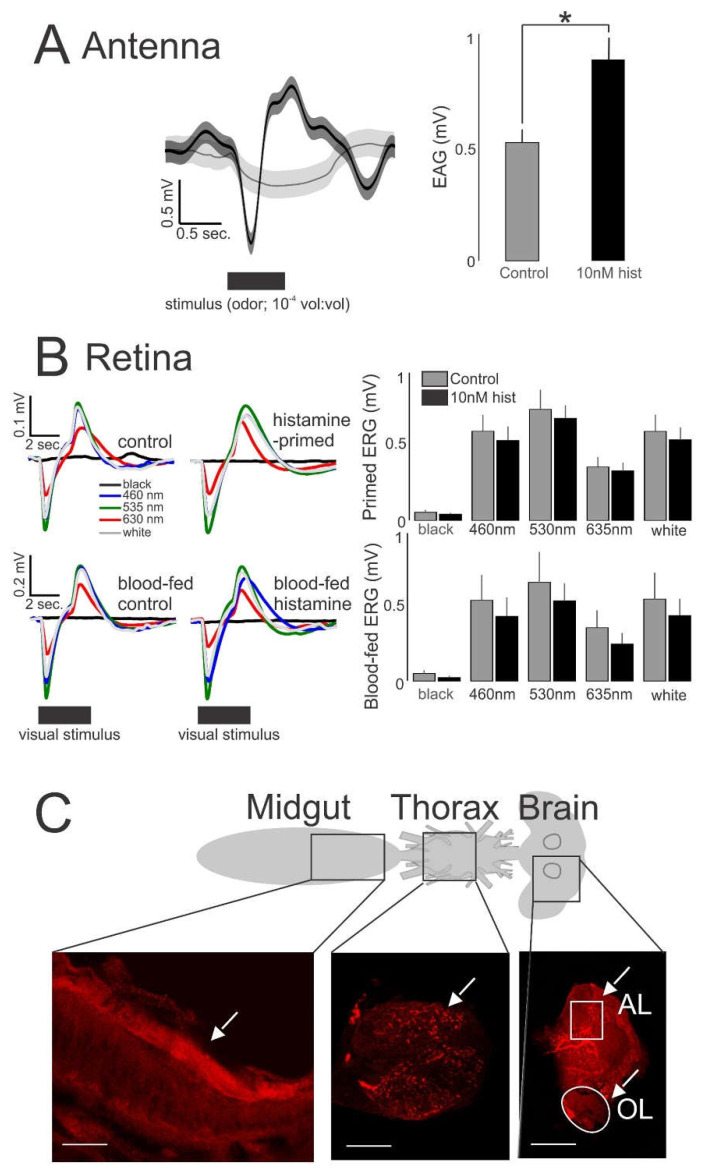
Figure 6.
Electrophysiological recordings and histaminergic innervation of An. stephensi tissues. (A) Histamine (hist) priming caused increased EAG responses (n = 15) that were significantly greater than control (t-test: * p = 0.04). The traces show the mean response for the two treatment groups (left); the bars are means ± SE (right). (B) ERG responses (n = 30) to different light stimuli. Responses were not significantly different between histamine-treated (primed and blood-fed) and control groups (t-test: p > 0.05). Traces are responses to the light stimuli for the primed mosquitoes (left, top) and blood-fed mosquitoes (left, bottom). Bars are the means ± SE (right). (C) Schematic of An. stephensi tissues (midgut, thoracic ganglion, brain) that were immunolabeled for histamine. The white arrows denote the strong histamine staining (red) of the midgut lining (left, bottom) and neuropil in the thoracic ganglion (middle, bottom). Section of the brain shows strong immunolabeling of histamine in cell clusters immediately anterior to the antennal lobe (AL) and cells adjacent to the olfactory lobe (OL). White lines denote 100 μm distance.

