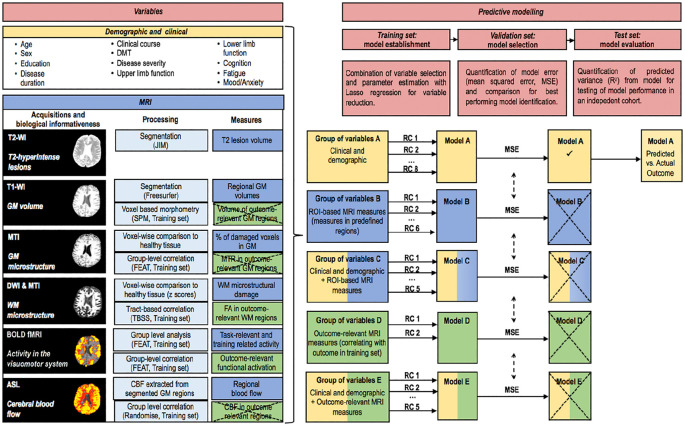
Figure 2.
Overview of the analysis. All the demographic, clinical and MRI variables considered for the modelling are listed (left). For each type of the MRI variable, the acquisition sequence, the biological informativeness, the main processing steps and the extracted measures are indicated. ROI-based and outcome-relevant measures are indicated in blue and green boxes, respectively. Crossed boxes indicate non-significant results. The extracted measures that survived the statistical analysis were considered for the development of the predictive models. All variables were clustered in groups on the basis of their type (demographic and clinical, ROI-based MRI, outcome-relevant MRI) or combinations of types (right). First, within each group of variables (A–E), a lasso regression was performed in the training set, resulting in a number of retained variables and their corresponding regression coefficients. Second, these were applied to the validation set in order to quantify the modelling error (MSE). Third, the model with the lowest model error in the validation set (model A) was applied to the test set to assess the relationship between the outcome predicted by the model built in the training set and the actual outcome as measured in the test set. Crossed boxes indicate that the model did not survive the comparison of MSE.
T2-WI: T2-weighted image; T1-WI: T1-weighted image; GM: grey matter; MTI: magnetisation transfer imaging; DWI: diffusion-weighted imaging; BOLD: blood oxygenation level dependent; ASL: arterial spin labelling; DMT: disease-modifying treatment; MSE: mean squared error; WM: white matter; SRT: serial reaction time; RC: regression coefficient; ROI: region of interest.

