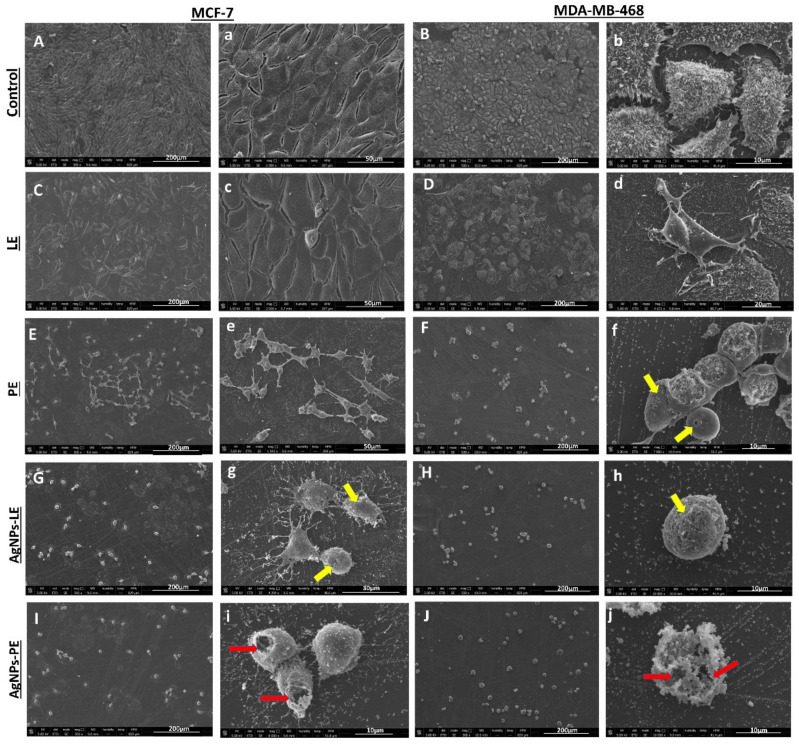
Figure 6.
Microscopy micrographs of MCF-7 and MDA-MB-468 cells after 6 days of IC50 treatments with different compounds. Cell controls are shown in (A,a,B,b) under treatment with LE extract (C,c,D,d) showed cells with epithelial form strongly adhered to the surface of the culture coverslip, and PE show cells with loss of microvilli (E,e,F), in addition to multiple pores (arrows yellow) (f), the micrographs of the cells treated with AgNPs-LE show a decrease in cells compared to the controls (G,H). Cells treated with NPs also showed pore formation (yellow arrows, g,h) and a flatter cell surface than controls, due to the loss of microvilli and filopod structures. Cells treated with AgNPs-PE (I,J) also show cell decrease, in addition to giant cells with destructured cytoplasmic membrane (red arrows, i,j) Scale bar (200–10 µm).

