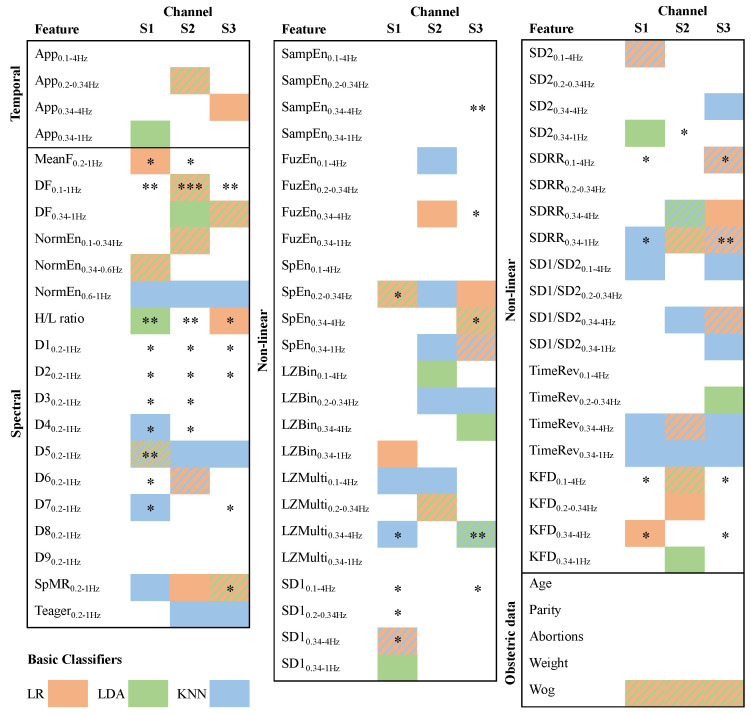
Figure 3.
Optimized feature subset (best chromosomes) achieved using genetic algorithm for each base classifiers implemented with LR (orange), LDA (green), and KNN (blue). A single frame color indicates that a feature is part of the classifier’s best chromosome identified with that color; two and three frame colors indicate that the feature belongs to two and three classifiers’ best chromosome, identified with the corresponding colours. *, ** and *** mean a p-value of the Wilcoxon Rank-Sum test lower than 0.05, 0.005 and 0.0005, respectively, computed by each feature between preterm and term labor classes.

