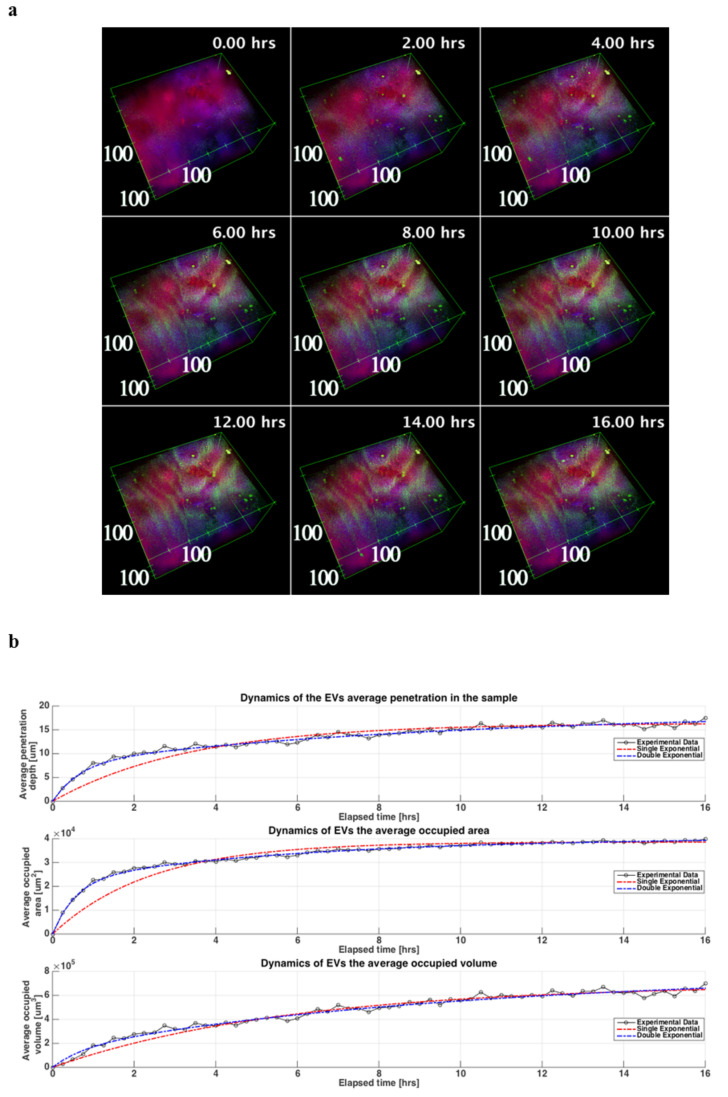
Figure 4.
ASC-EVs kinetic of penetration in OA cartilage. (a) 3D reconstructions of the cartilage explant during the time-lapse experiment where the cells and the rich lipidic structures are shown in red (CARS signal at 2848 cm−1 from lipid structures), the collagen rich ECM is shown in blue (SHG signal from collagen) end the EVs are shown in green (TPEF signal from EVs fluorescence stain). In the box is shown the scale in μm, while in the upper right corner is depicted the corresponding time of the image during the experiment. The reconstructions are obtained from the acquired images and processed using 3Dviewer with ImageJ. (b) Three graphs of the dynamics of the EVs in the tissue during the time-lapse related to the depth, the area and the volume are showed. For each curve are also plotted the related fitting in blue the double exponential one (Equation (1) in Table S6) and in red the single exponential one (Equation (2) in Table S6).

