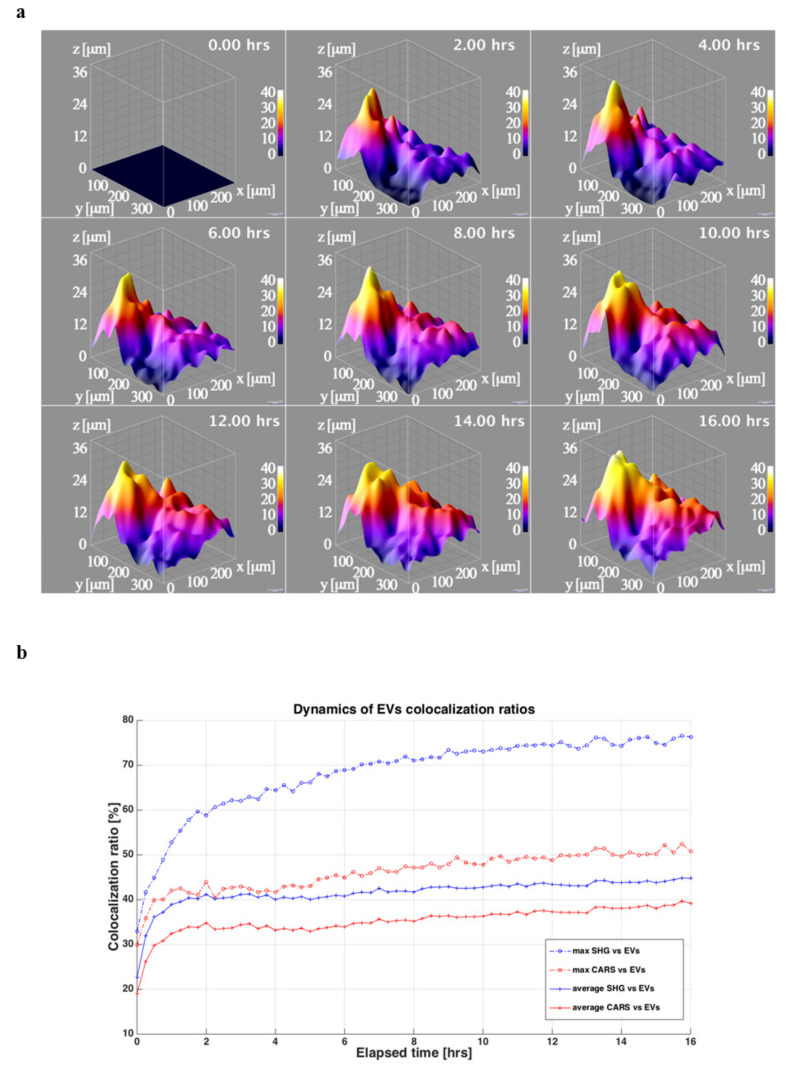
Figure 5.
ASC-EVs diffusion in OA cartilage cells and matrix. (a) 3D surfaces showing the EVs penetration depths extracted from the acquired 3D imaging. In the upper corner are visible the corresponding time in the time-lapse experiment. The 3D surface graphs are obtained from the extracted EVs penetration depths images using the ImageJ3D plugin setting smoothing value at 10 pixels. (b) Dynamics of the co-localization ratios between the cells and the lipidic structure (CARS) and the EVs in red and between the collagen (SHG) in the ECM and the EVs in blue. For each ratio is reported the average (continuous line) and the maximum value (dash-dotted line) in the Z stack for that time step.

