Figure 2:

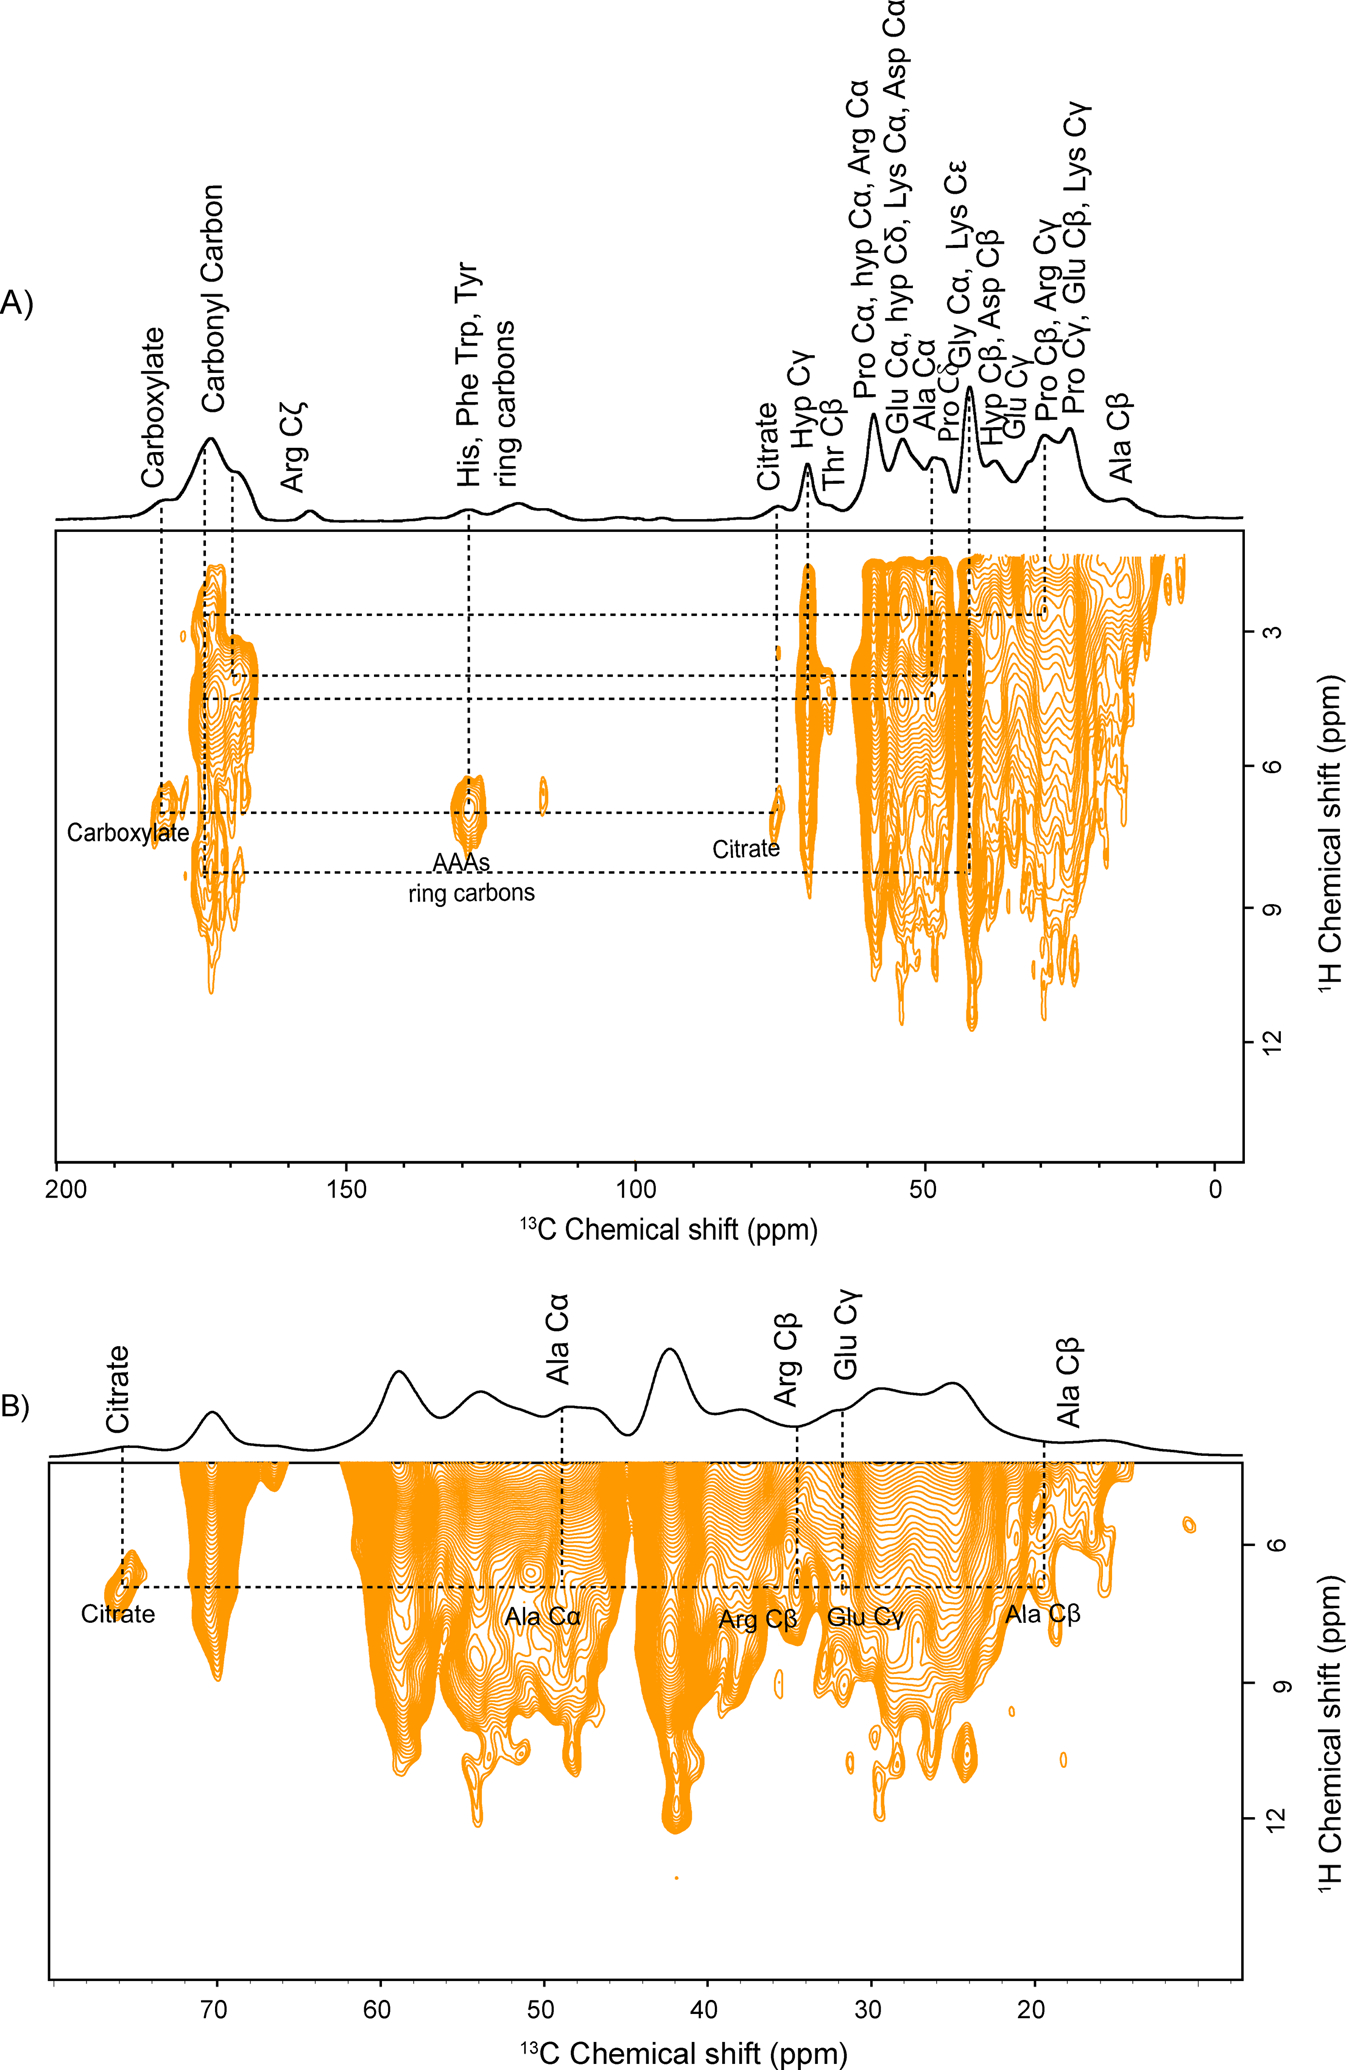
A) Natural abundance 2D PMLG 1H-13C HETCOR spectrum of bone ECM and B) expanded region of fig.(A), showing molecular interaction between citrate and collagen residues along with other molecular interactions represented by the dotted line.

A) Natural abundance 2D PMLG 1H-13C HETCOR spectrum of bone ECM and B) expanded region of fig.(A), showing molecular interaction between citrate and collagen residues along with other molecular interactions represented by the dotted line.