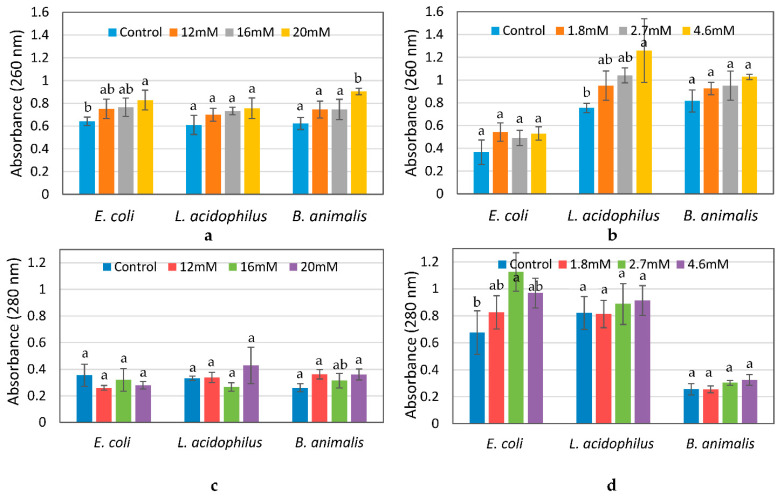
Figure 10.
Nucleic acid (a,b) and protein (c,d) leakage from E. coli, L. acidophilus, and B. animalis after treatment with ZnO NPs (a,c) for 10 h and Ag NPs (b,d) for 6 h, as measured by absorbance at 260 nm and 280 nm, respectively. Different lowercase letters (a, b) indicate significant differences (p ≤ 0.05).

