
Figure 4. Growth factor release profiles of Alg-G-H gel with ECM compared to Alg gel alone after 2 weeks of induction.
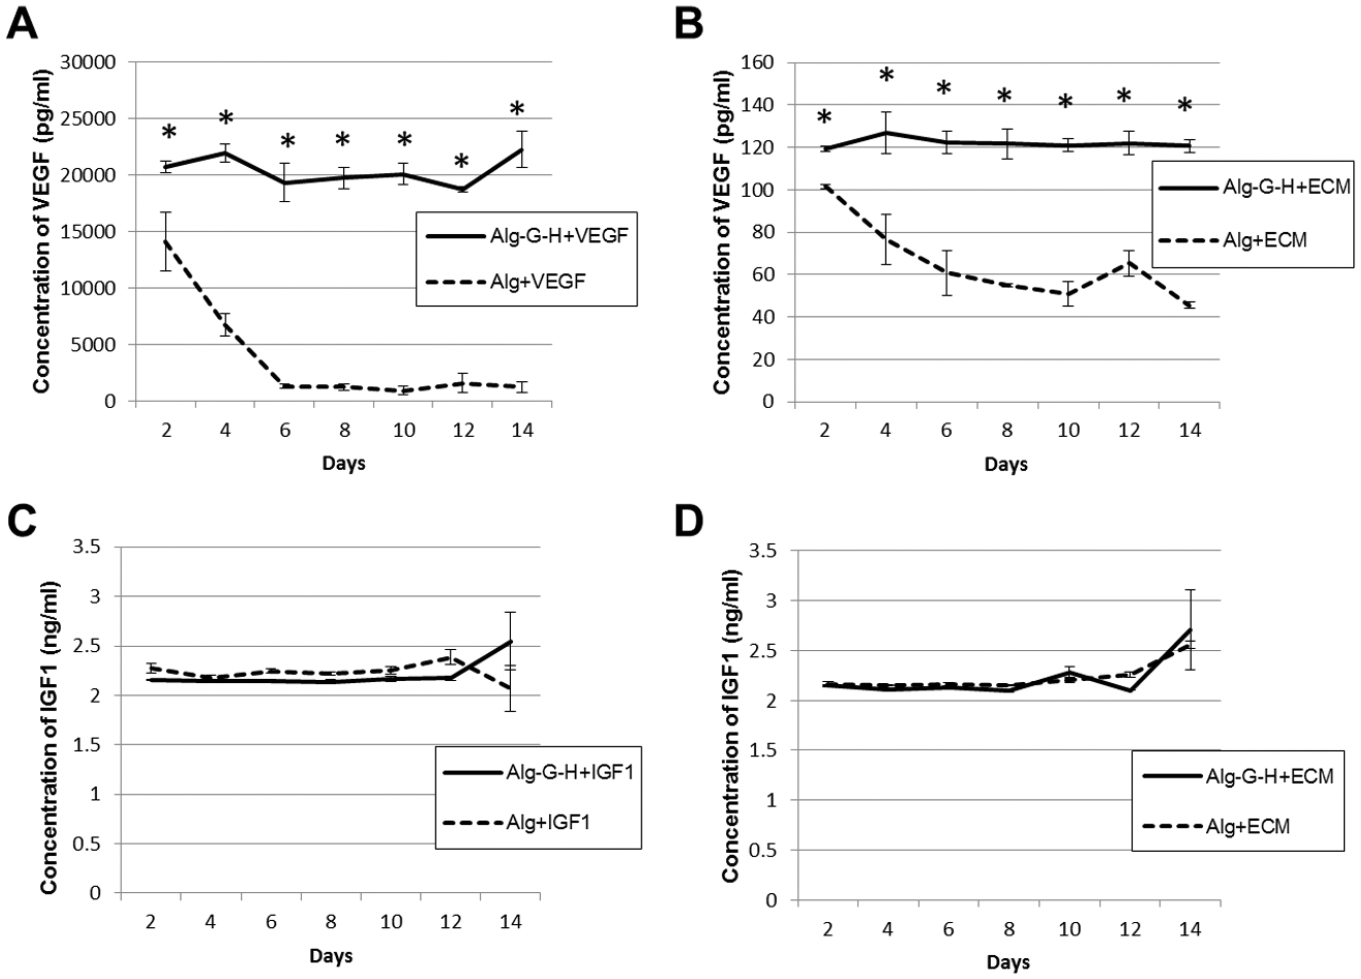
A) VEGF release in Alg alone and Alg-G-H conditions. B) VEGF release in Alg+ECM and Alg-G-H+ECM conditions. C) IGF1 release in Alg alone and Alg-G-H conditions. D) IGF1 release in Alg+ECM and Alg-G-H+ECM conditions. Data are shown for 3 independent experiments with 3 replicates as mean ± SEM. Student’s t test was used for calculation of the statistical significance between different release conditions at each time point, * p<0.05.