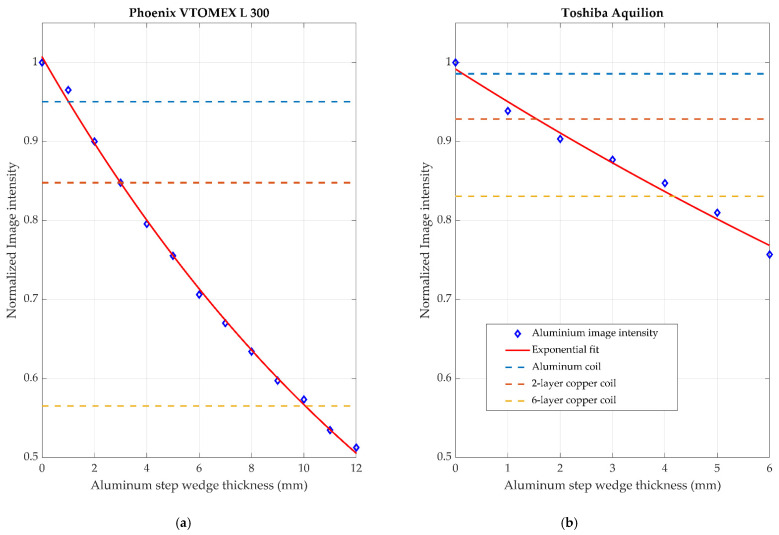
Figure 21.
The normalized intensity of the image background in reference to the aluminum step wedge thickness. (a) shows the results from the Phoenix VTOMEX L 300 industrial microCT scanner and (b) shows the results from the Toshiba Aquilion medical CT scanner. The intensity of each of the materials is normalized to the measured background intensity of the X-ray images used.

