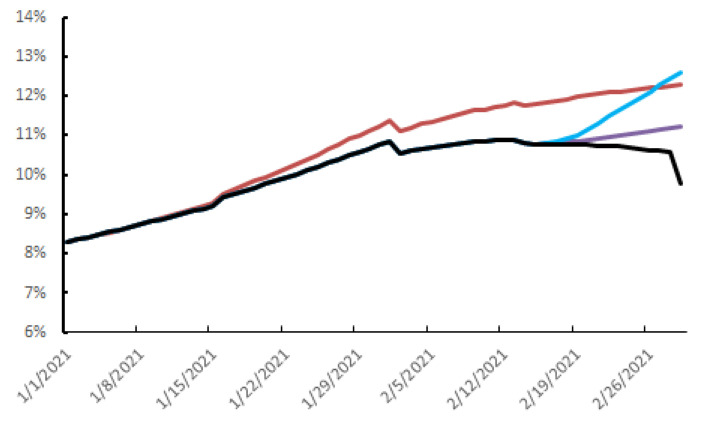
Figure 3.
Daily spread of SARS-CoV-2 infection, 1 January 2021 to 1 March 2021 depending on the vaccine strategy and the release of public health measures or testing–tracing from 14 February 2021. Black curve: current situation, purple curve: reducing mass testing by half, blue curve: end of mass testing strategy, red curve: no vaccination strategy.

