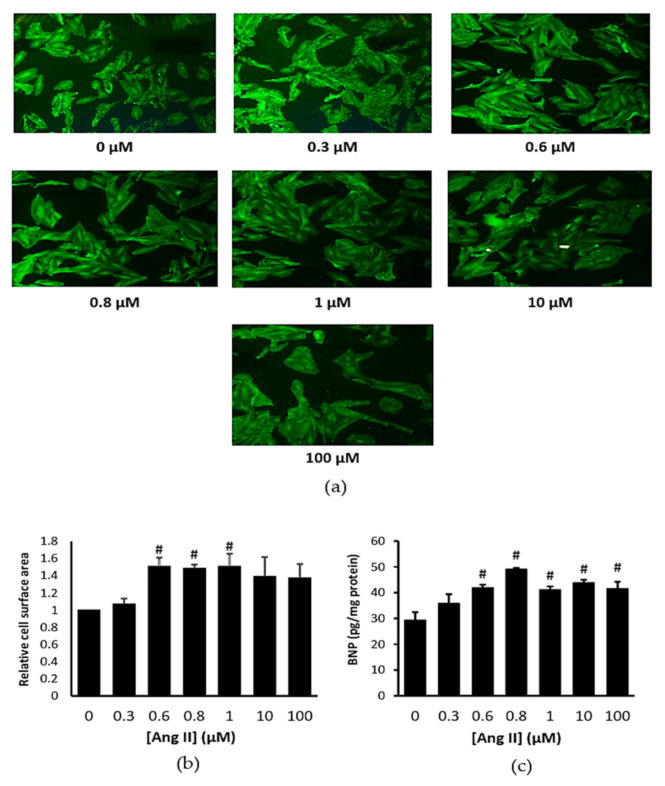
Figure 1.
(a) Representative immunofluorescent staining (magnification ×100), (b) cell surface area, and (c) B-type natriuretic peptide (BNP) level in H9c2 cells exposed to Ang II at various concentrations for 24 h. # p < 0.05 versus control group. Data were analyzed by a one-way ANOVA followed by a Tukey post hoc test and are represented as the mean ± SEM (n = 3).

