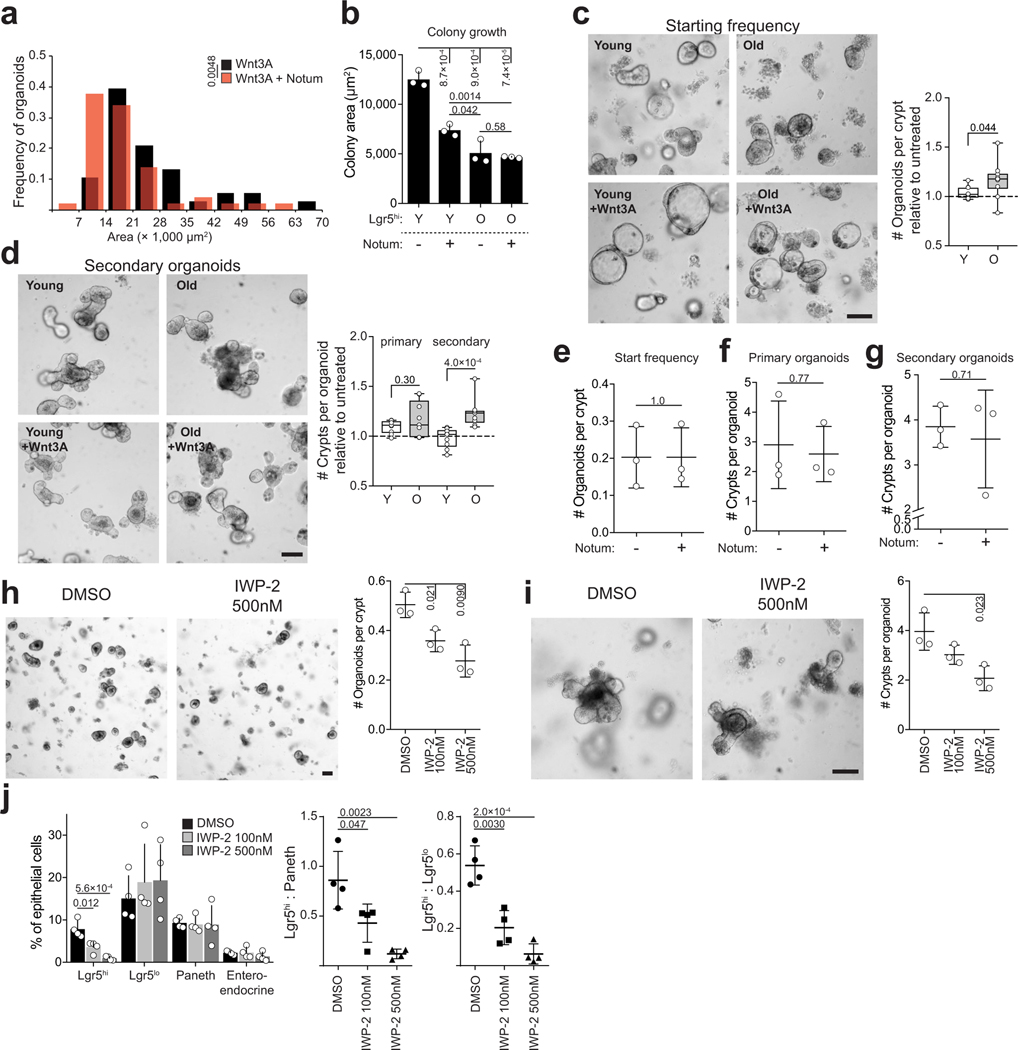
Extended Data Figure 3.
Wnt -ligands increase ISCs regenerative capacity
a, Distribution of organoid size on Day 5 in ENR + 100 ng/ml Wnt3A +/− 1μg/ml recombinant Notum (n=50 organoids for Notum treated (red), n=38 organoids for untreated (black)). b, Area of colonies from sorted Lgr5hi stem cells from young and old animals (n=3 animals per age group). Area quantified at Day 7. c, Organoid forming capacity of crypts from young and old mice treated with +/− 100ng/ml Wnt3A. Starting frequency was quantified on Day 2 and is represented relative to untreated control (n=10 animals per age group). d, Primary and secondary regenerative growth of young and old organoids treated +/− 100ng/ml Wnt3A for the first 2 days of culture. Primary organoids were quantified at Day 6 and secondary organoids 2 days after subculturing. Data is represented relative to untreated control (n=9 animals per age group). e, Organoid forming capacity of isolated crypts from young mice treated with +/− 1 μg/ml of recombinant Notum (n=3 animals). f, Primary regenerative growth of organoids from young mice treated with +/− 1 μg/ml of recombinant Notum quantified on Day 6 (n=3 animals). g, Secondary regenerative growth of organoids from young mice treated with +/− 1 μg/ml of recombinant Notum, quantified on Day 2 after subculture (n=3 animals). h, Organoid forming capacity of isolated crypts at Day 2 from young mice treated with Porcupine inhibitor IWP-2 (n=3 animals). i, Primary regenerative growth of organoids treated with IWP-2 for the first 2 days of culture. Organoids were quantified on Day 6 (n=3 animals). j, Flow cytometry analysis of cellular frequencies from Lgr5-EGFP organoids 2 days after treatment with IWP-2 (n=4 animals). Y = mice between 3 and 9 months of age, O = mice over 24 months of age in all experiments. Unless otherwise indicated, line at Box-and-Whisker -plots represents median, box interquartile range and whiskers range. All other data are represented as mean +/− s.d. and conditions compared with two-tailed unpaired Student’s t-test, exact P-values shown in corresponding panels. P-values < 0.05 were considered significant.

