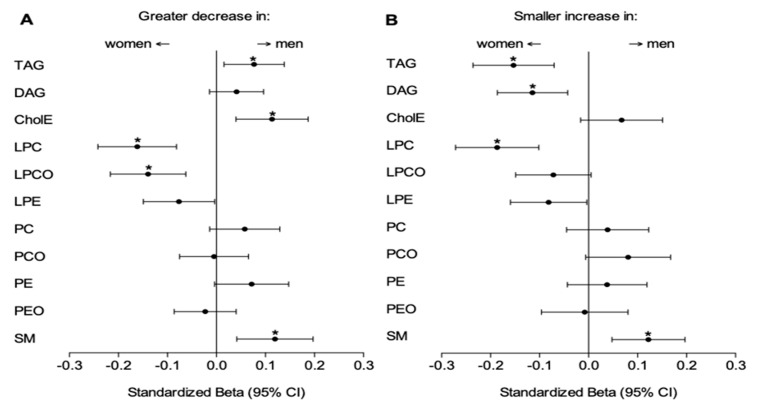
Figure 3.
Standardized Beta’s ± 95% confidence interval (CI) for the association between sex and the change in lipid groups following weight loss (from CID1 to CID2) (A) and after 6 months of weight maintenance (from CID2 to CID3) (B). A negative Standardized Beta indicates a greater decrease (A) or smaller increase in women (B) compared to men and vice versa. * Indicates a significant difference in change between men and women (q < 0.05 (=False Discovery Rate p-Value)) in a linear mixed model corrected for age, body weight (changes) and baseline differences.

