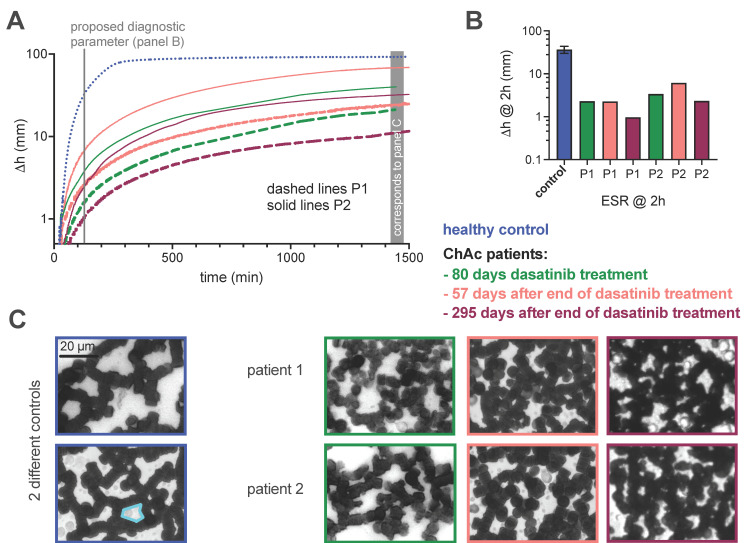
Figure 2.
Measurements of the ESR with the standard Westergren method using EDTA blood. (A) Plots of the color-coded sedimentation curves retrieved from optical images taken every minute, i.e., the density of the data points corresponds approximately to the printed resolution. (B) Comparison of the sedimentation height after 2 h, which was proposed to be a diagnostic biomarker [10]. Please note that panels (A,B) are logarithmic plots. (C) Representative micrographs of sedimented RBCs forming aggregates on a coverslip. RBC are diluted in plasma, forming a hematocrit of approximately 45% in the 2D layer on the coverslip. The cyan-framed area is an example to indicate a ‘hole’.

