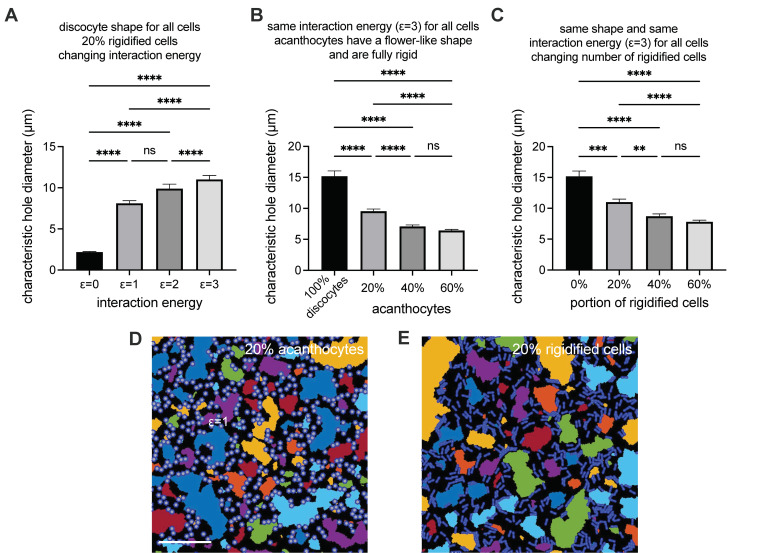
Figure 4.
2D modeling of RBC aggregation to better understand the dependence of characteristic hole size on the aggregation strength and fraction of acanthocytes. The larger the hole size, the faster the ESR. (A) Panel A shows hole sizes when only the interaction energy varies. An increase in the interaction energy mimics an increase in the plasma protein concentration, mainly the fibrinogen. (B) Panel B represents the situation of a variable number of acanthocytes, whereas acanthocytes have a different shape and are completely rigid. (C) Panel C depicts the situation when the interaction energy is constant, and all cells have the same discocyte shape, but the number of rigidified cells increases. ** refers to a significance level of p < 0.01, *** to p < 0.001 and **** to p < 0.0001. The abbreviation ns stands for not significant. (D,E) are example images for 20% acanthocytes and 20% rigidified cells respectively, as presented in panels (B,C). For a better visualization, the holes are marked in a variety of false colors. The scale bar refers to 100 µm.

