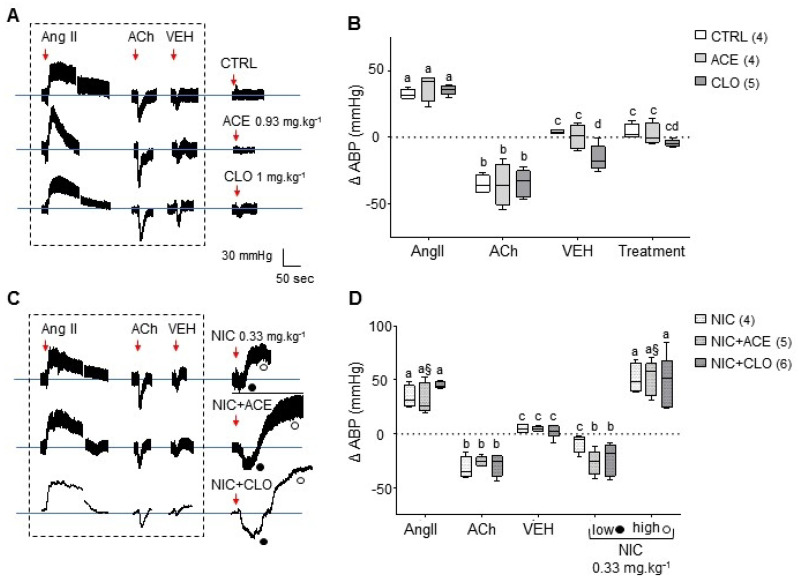
Figure 5.
Influence of NIC, ACE and CLO on rat ABP. (A) Representative raw traces of ABP following ACE or CLO infusion (red arrow with doses used) compared to the CTRL group. As expected, protocol assessment molecules such as AngII (1.05 × 10 mg·kg) and ACh (0.5 × 10 mg·kg) induce increased and decreased ABP, respectively. Neither DMSO 0.5–3% (VEH) nor ACE or CLO affected ABP, whatever the dose tested. (B) Box and whisker plots of ABP data in the CTRL, CLO and ACE groups following i.v. injections, 0.93 mg·kg for ACE and 1 mg·kg for CLO. (C) Representative raw traces of ABP following infusions of NIC alone or NIC with either ACE or CLO. NIC was used at 0.33 mg·kg (red arrow) in combination with a single dose of ACE (0.09 mg·kg) or CLO (0.33 mg·kg). AngII, ACh and VEH infusions triggered BP response as expected. In addition, 0.33 mg·kg NIC induced a BP increase as expected, while its combination with either ACE or CLO was responsible for a biphasic response with low (o) and high (•) ABP. (D) Box and whisker plots of ABP data in the NIC, NIC+ACE and NIC+CLO groups following the various infusions cited above. Whiskers are minimum to maximum values and bar represents the median value. Different lowercase letters and § above the graphs indicate significant differences between treatments according to Tukey’s multiple comparison post hoc test (p < 0.05).

