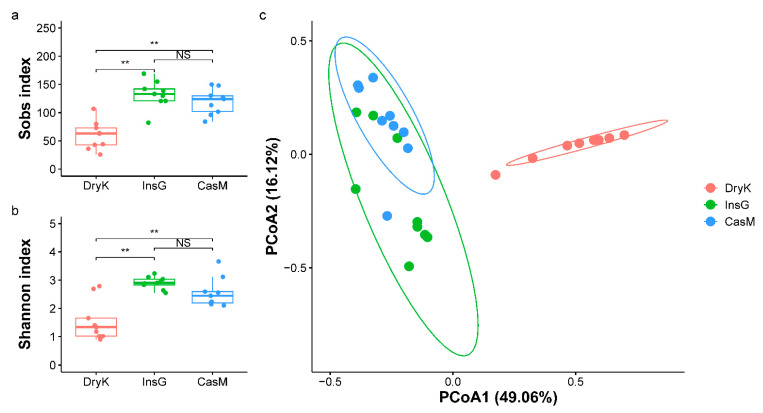
Figure 2.
The fungal richness, α-diversity and community structure of DryK, InsG and CasM at the species level. (a). Boxplot of fungal richness at the species level of DryK, InsG and CasM, as measured by the Sobs index. (b). Boxplot of fungal α-diversity at the species level of DryK, InsG and CasM, as measured by the Shannon index. ** Indicates a significant difference (p < 0.01) (ANOVA in (a); Kruskal–Wallis in (b)), and NS indicates that any difference is not significant. The top and bottom horizontal lines of the boxplot indicate 25th and 75th percentiles, respectively. The lines within the box indicate median values, while vertical lines indicate the 10th and 90th percentiles. (c). Principal coordinates analysis (PCoA) based on weighted UniFrac distance at the species level of the fungal community structure of DryK, InsG and CasM. The horizontal and vertical axes indicate the first and second principal coordinates (PCoA1 and PCoA2, respectively). The percentage indicates the proportion of the total variation explained by each principal coordinate. The ellipses represent the 95% confidence interval around the centroid for DryK, InsG or CasM. DryK, InsG and CasM represent Dryocosmus kuriphilus adults, associated insect galls and the galled twigs of Castanea mollissima, respectively.

