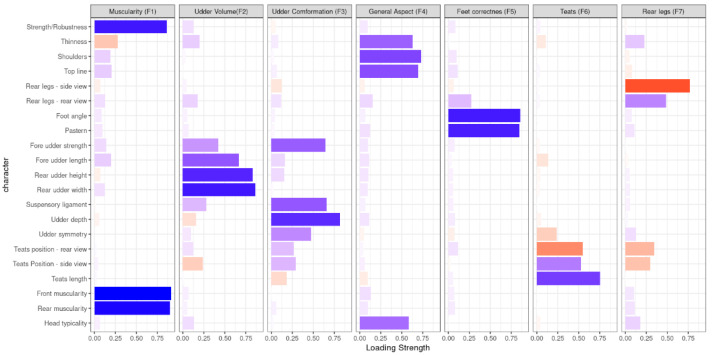
Figure 1.
Loading coefficient (LC) of individual morphological traits within the seven latent factors extracted from the factor analysis (i.e., with eigenvalue > 1) after the varimax rotation. Only LC ≤ −0.45 or ≥0.45 have been reported. Blue bars represent positive loading coefficients, red bars negative loading coefficients.

