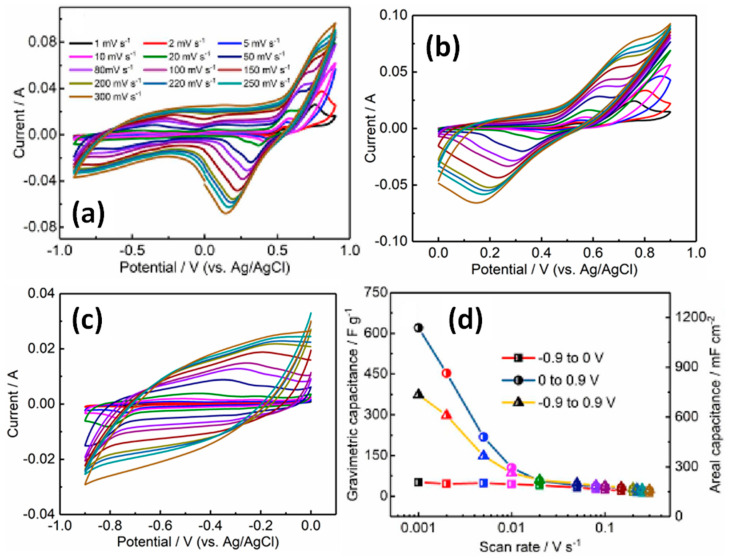
Figure 21.
CV curves obtained at different scanning rates for CNT@G with mass loading of 3 mg/cm2 measured in potential window from −0.9 V to +0.9 V (a), from 0 to +0.9 V (b), from 0 to −0.9 V (c), and corresponding specific capacitances (d) (Reproduced with permission of [46]. Copyright Elsevier, 2019).

