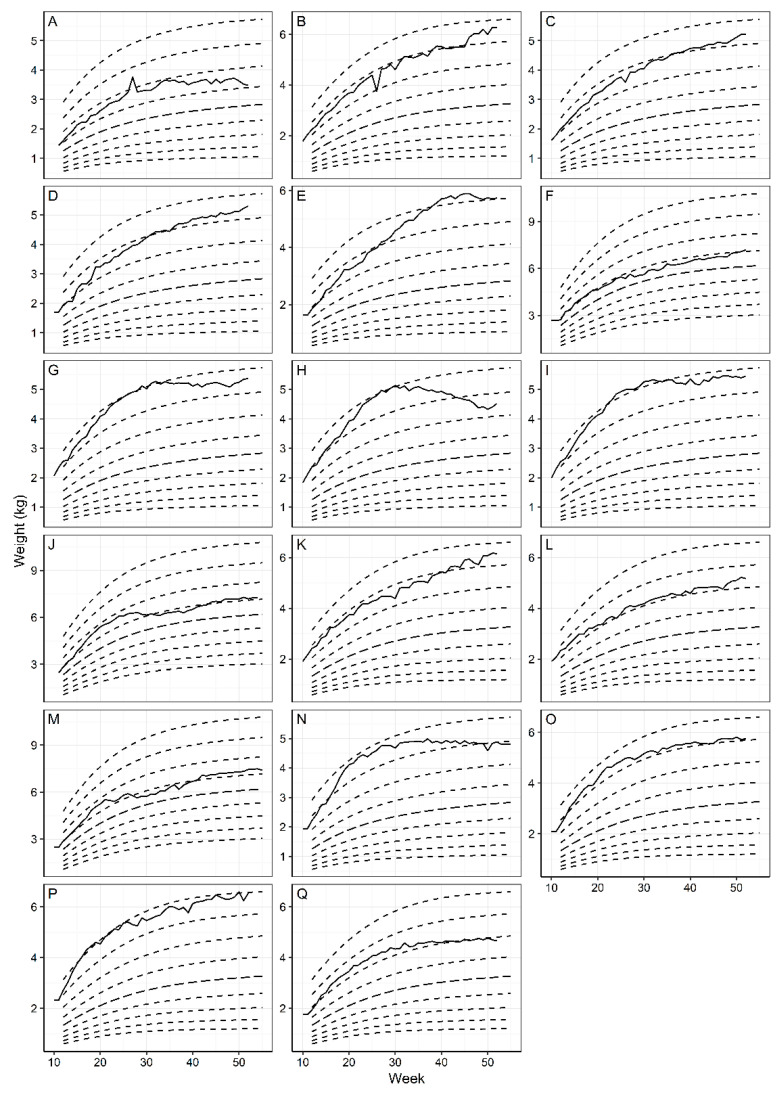
Figure 3.
The growth trajectory for each dog was plotted throughout the study using WALTHAM Puppy Growth Charts. (A–Q) designate the data for each of the 17 dogs. Two different size charts were used based on the predicted adult bodyweight of each puppy. Charts (A–E), (G–I), (K–L) and (N–Q) were charts for <6.5 kg and charts (F,J,M) were charts for 6.5–9 kg. All but one dog (E) remained within two centile lines.

