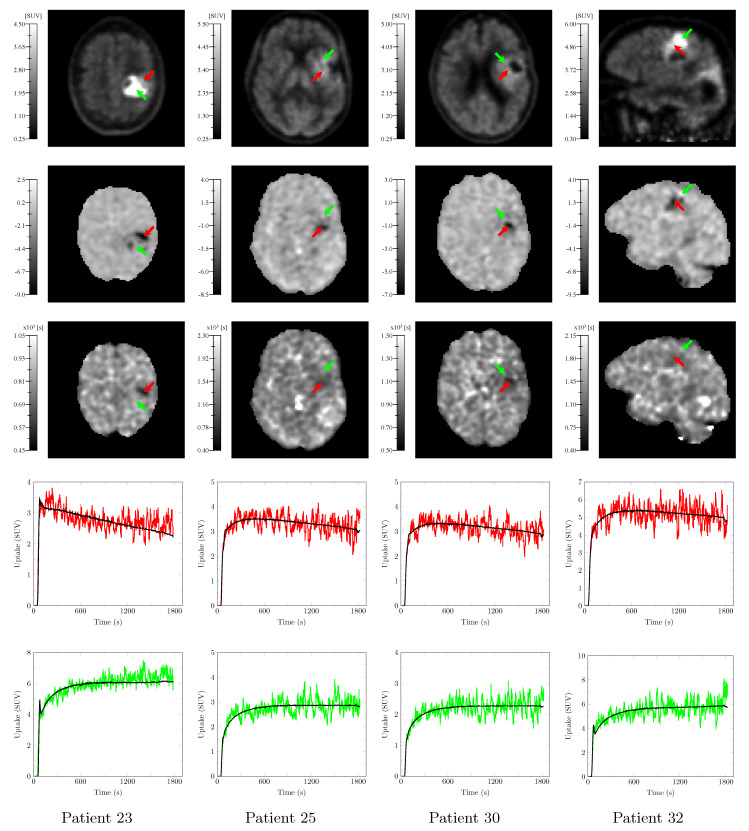
Figure 8.
Static PET image (20–27 min p.i.—1st row) and PC3 (2nd row) and (3rd row) maps computed from the dynamic [11C]MET PET scans of four evaluation patients (patients 23, 25, 30, and 32 in Table A1) along with the smoothed TACs at voxels pointed by the red (4th row) and green (5th row) arrows, respectively. Red TACs have a ‘decreasing’ or ‘flat’ behavior whereas green TACs have a ‘flat’ or ‘increasing’ behavior. TAC reconstruction with 4 of the 5 principal components (PC1–3 and 5) is superimposed in black to each TAC.

