
Figure 3:
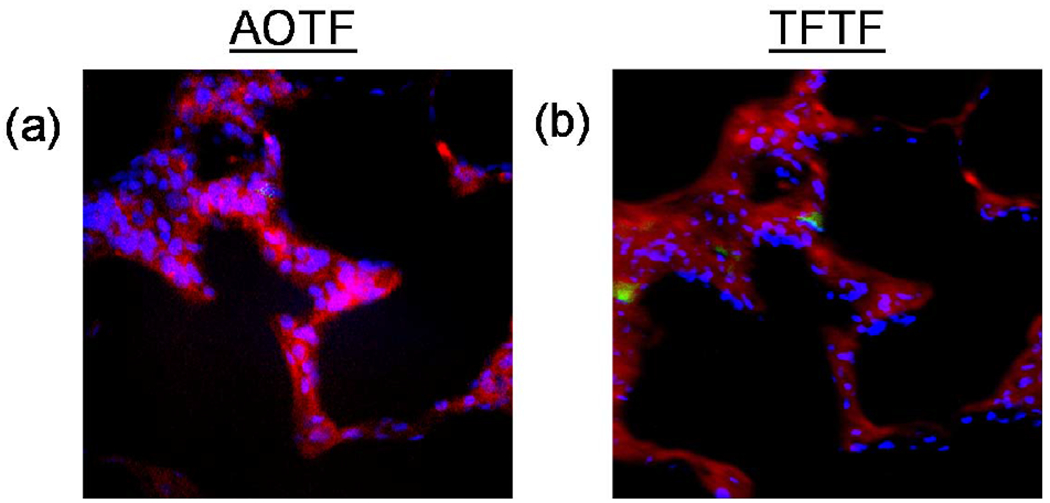
Unmixed images from the AOTF (a) and TFTF (b) were false-colored and merged using Nikon Elements software. Hoechst-stained nuclei were colored blue, GFP-expressing pulmonary microvascular endothelial cells were colored green, and tissue autofluorescence was colored red.