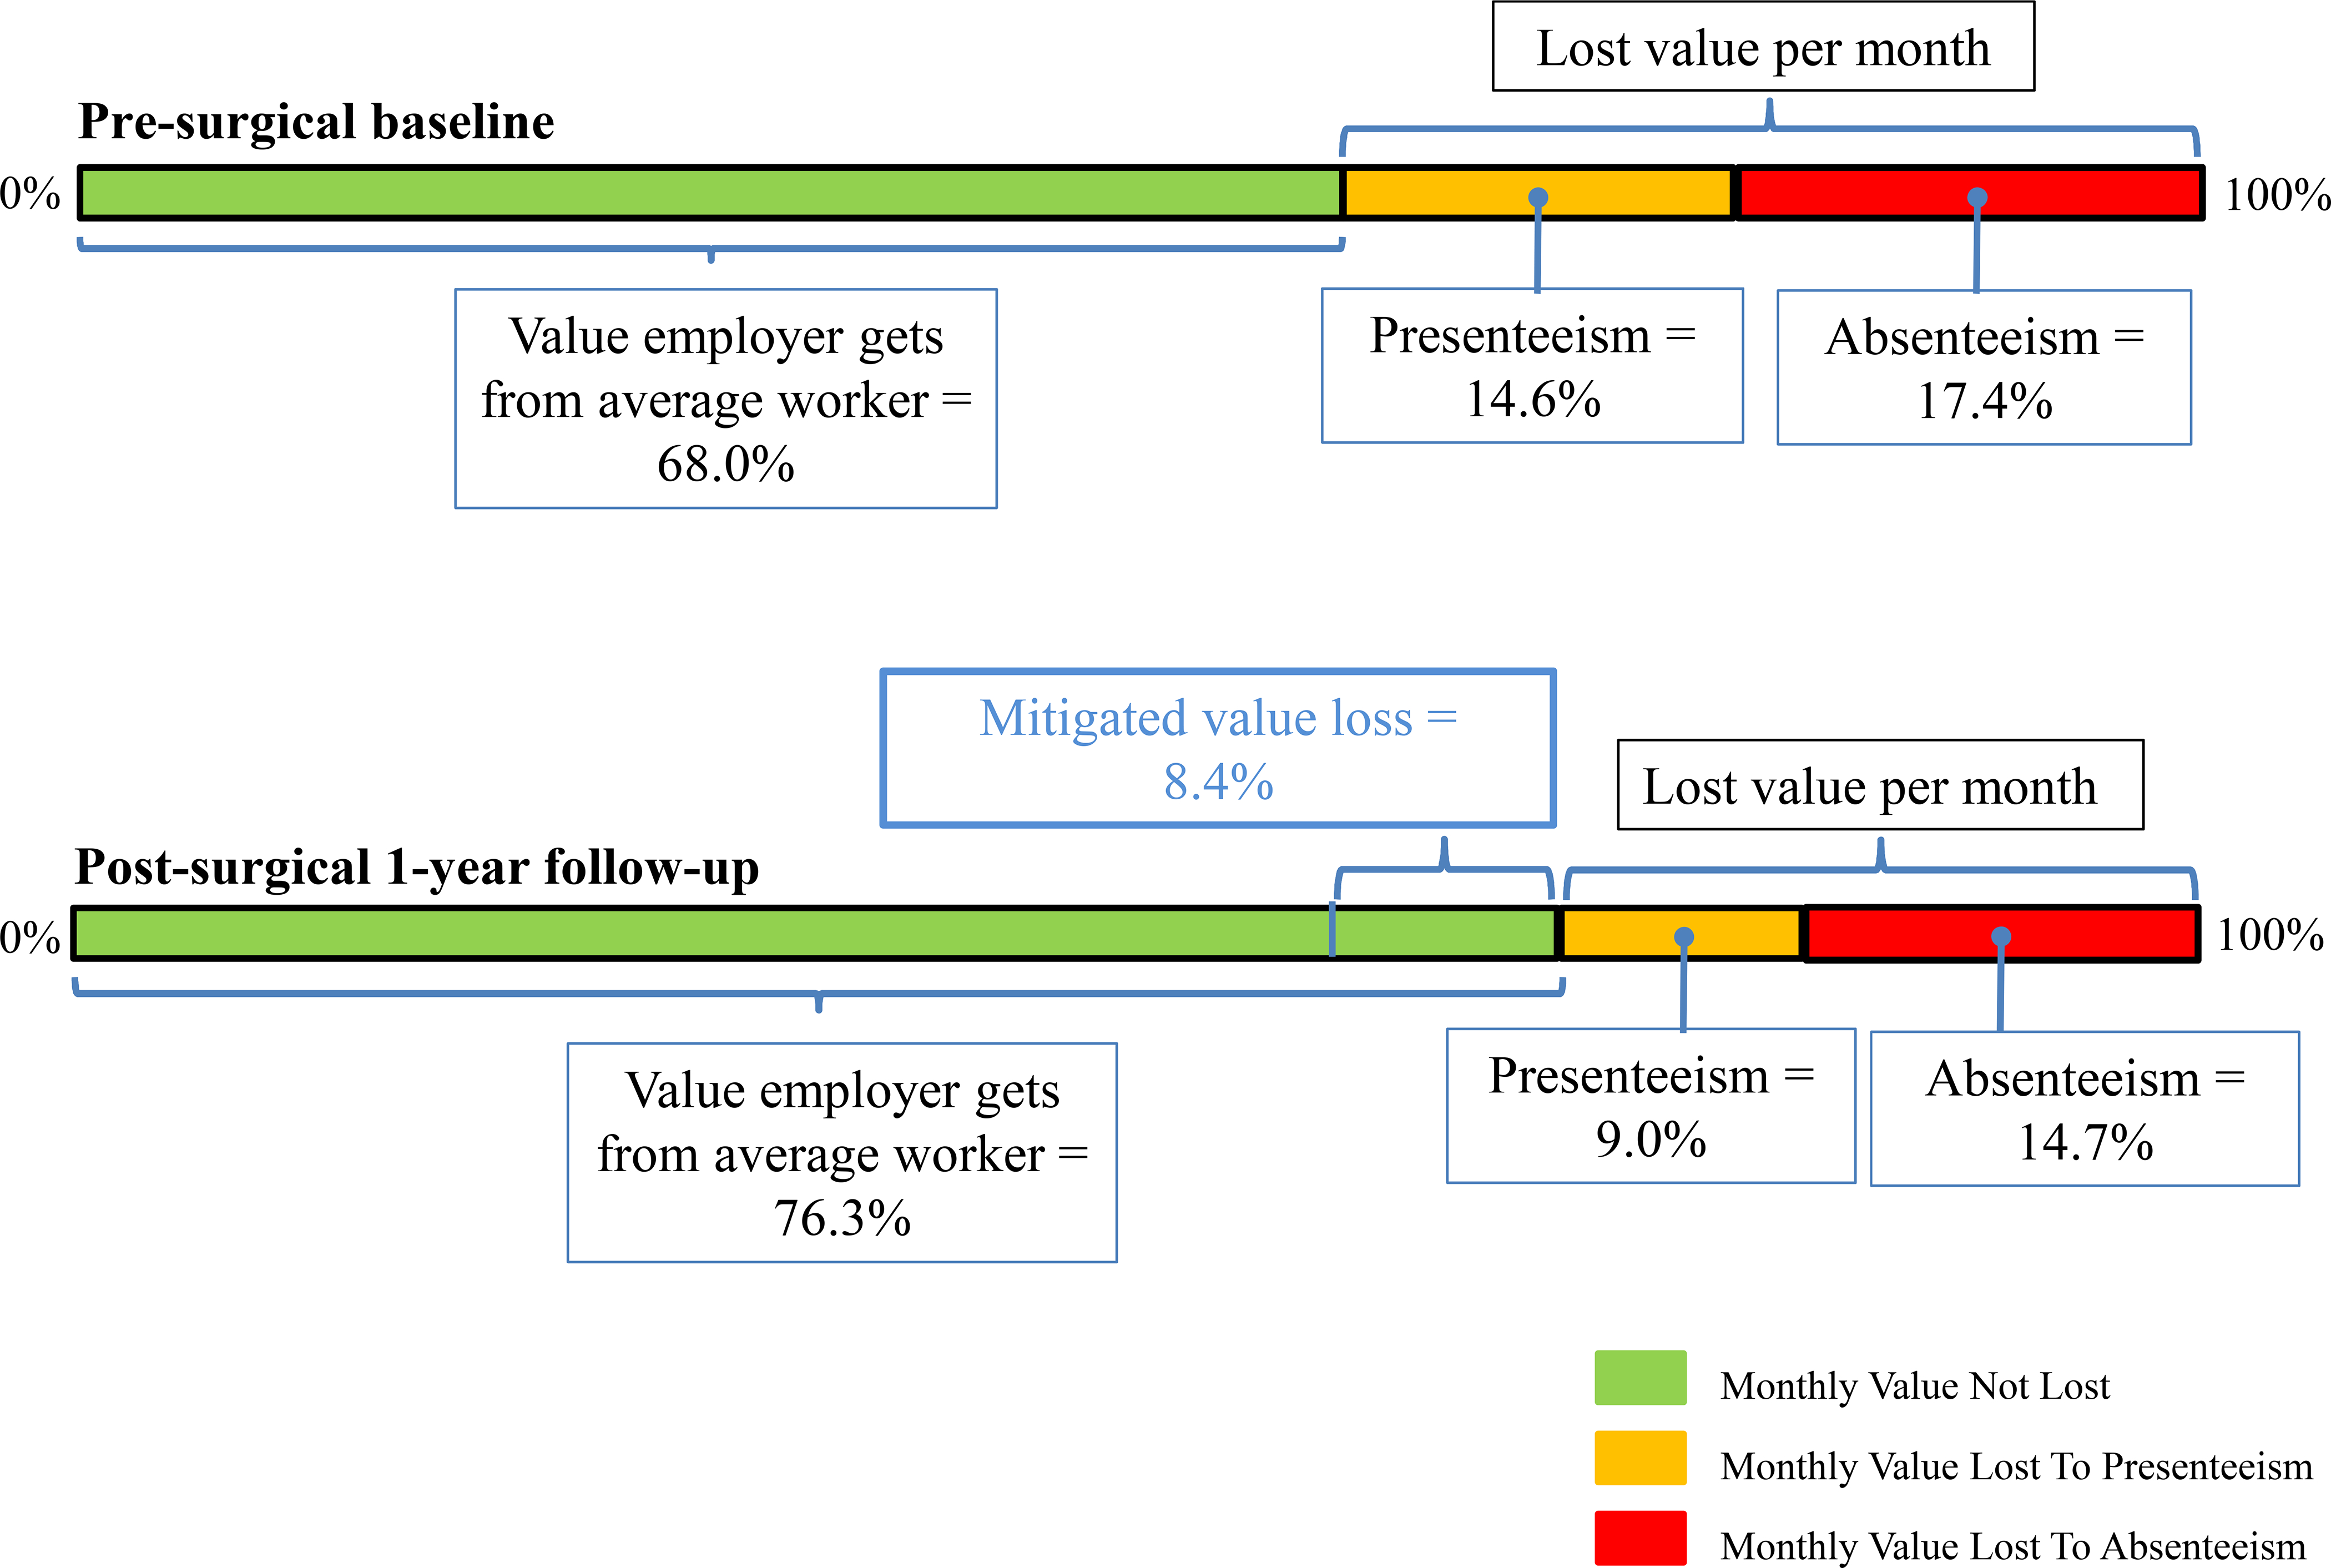
Figure 3. Monthly value lost before and after total knee arthroplasty.

Shown is the average monthly value lost in percentage terms from absenteeism (red, assuming time absent because of personal health problems, family health problems, or other reasons including vacation is completely lost) and presenteeism (orange, assuming value of non-absent work is reduced proportionally) at both pre-surgical baseline (top) and post-surgical one-year follow-up (bottom). Green indicates the value not lost to absenteeism nor presenteeism per month. The green to the right of the blue line (below) indicates the monthly value loss mitigated after surgery, i.e., the combined reduction in absenteeism and presenteeism between baseline and one year.
