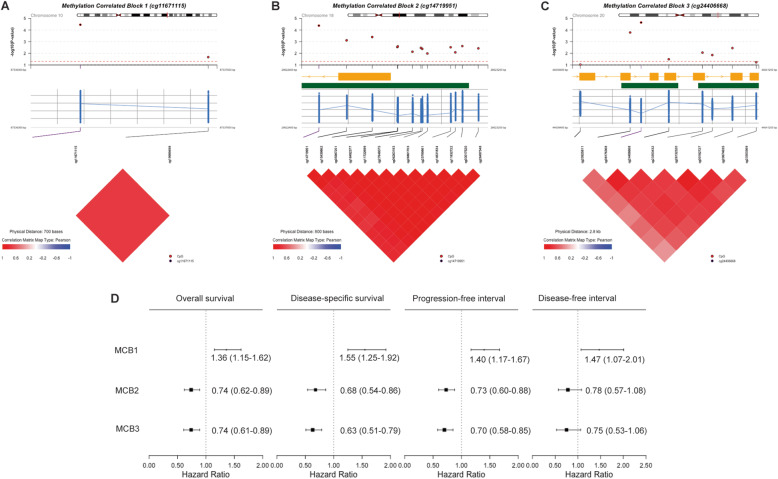
Fig. 1.
Methylation correlated blocks (MCBs). a MCBs based on cg11671115 and adjacent CpG sites in chromosome 10. b MCBs based on cg14719951 and adjacent CpG sites in chromosome 18. c MCBs based on cg24406668 and adjacent CpG sites in chromosome 20. d Forest plots indicating the association between DNA methylation of three MCBs and four clinical endpoints. For (a), (b), and (c), the circles indicate P-values of the associations between each CpG within the MCBs and OS. The red dotted lines represent the significant level (P = 0.05). The yellow bars represent locations of genes and the green bars represent locations of CpG islands. The blue dots represent DNA methylation level of each CpG within the MCBs. The blue lines connect mean DNA methylation level of each CpG within the MCBs

