Figure 2.
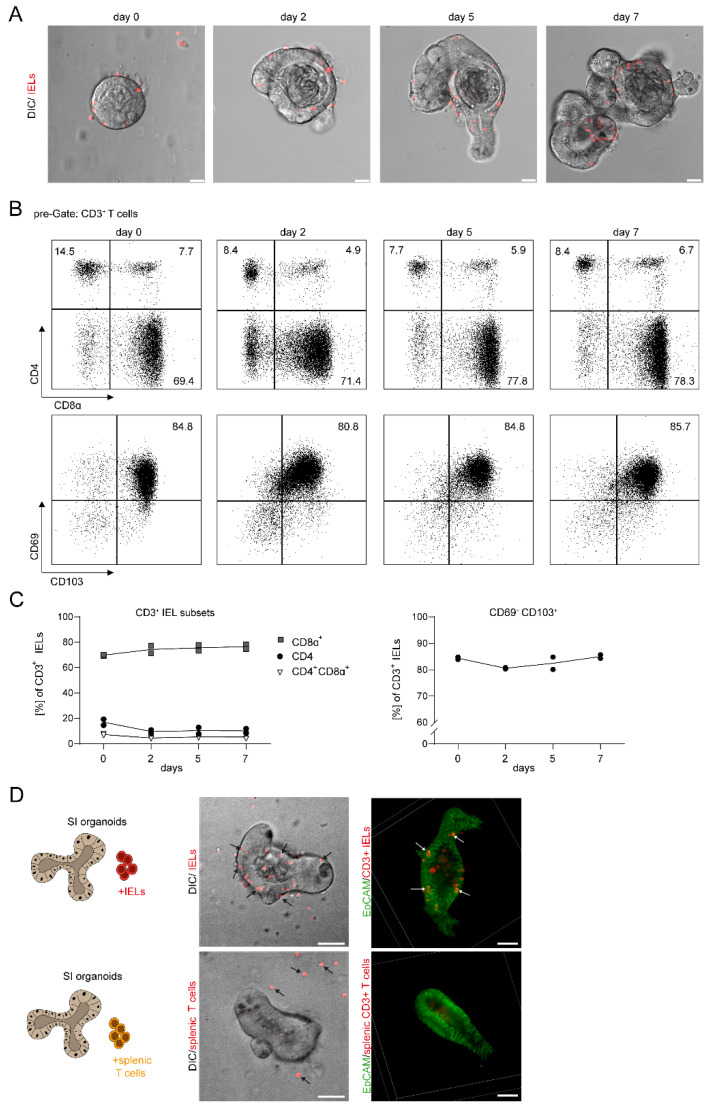
IELs remain alive, phenotypically stable, and localize to the IEC layer during a prolonged period of ex vivo co-culture. (A) IEL-IEC co-cultures with fluorescently pre-stained IELs (Cell Proliferation Dye, red) were monitored by confocal microscopy by SP5 in DIC from day 0 to day 7. Co-cultures were split before imaging. Scale bar 25 µm. Representative images of at least three independent experiments are shown. (B) IELs were removed from IEL-IEC co-cultures at different time points as indicated, stained with fluorescently labeled antibodies directed against CD3, CD4, CD8α, CD69, and CD103, and analyzed by flow cytometry. Representative FACS blots of two independent experiments are shown. (C) FACS-based kinetic analysis is shown for the expression and ratio of selected surface markers on CD3+ IELs obtained from IEL-IEC co-cultures as indicated. Results are pooled from two independent experiments. (D) Co-cultures were set up with small intestinal IEC organoids and either IELs or splenocytes from tdTOMATOCD4/CD8 reporter mice (red) as indicated. Co-cultures were analyzed by live cell imaging with confocal microscopy in DIC with the spinning disc (left) or after fixation and IF staining for EpCAM (right) with T cells from tdTOMATOCD4/CD8 mice. IELs and splenic T cells are shown in red. Arrows point to typical localizations of IELs and splenocytes, respectively. Scale bar 50 µm. Co-cultures with T cells from tdTOMATOCD4/CD8 reporter mice were incubated overnight before imaging. Representative images of three independent experiments are shown.

