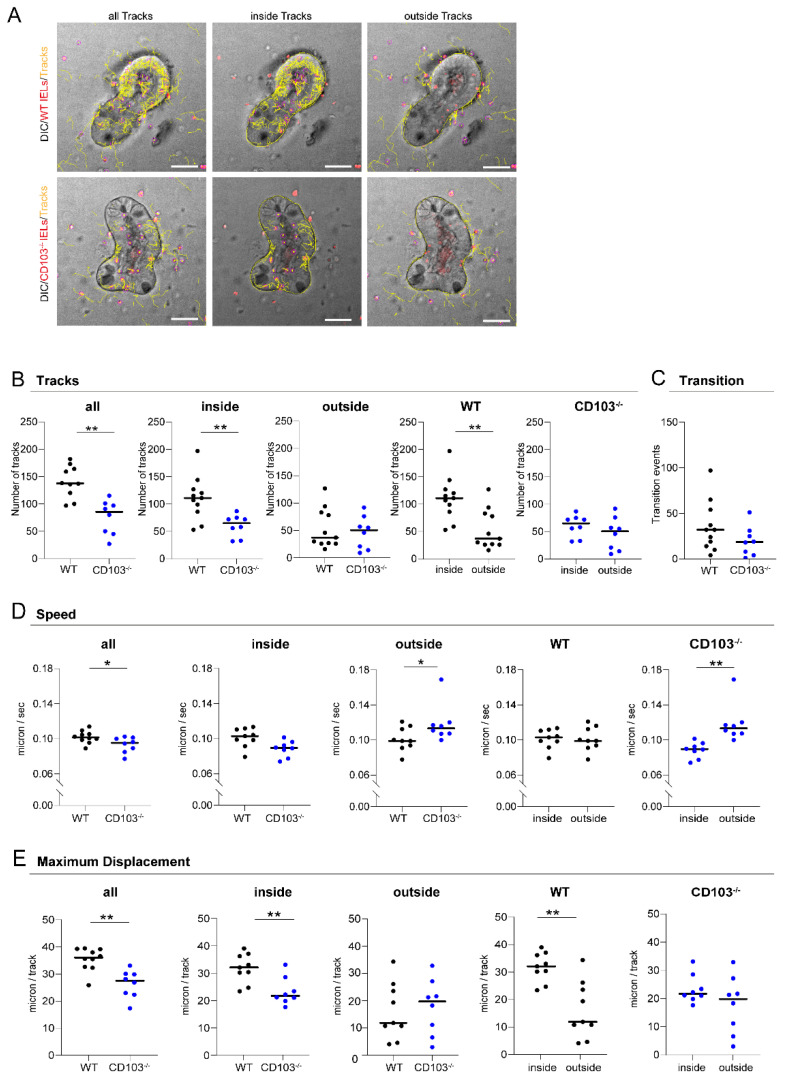
Figure 4.
CD103-deficient IELs display aberrant mobility and migration patterns. (A) IEL-IEC co-cultures with two days old organoids and fluorescently labeled IELs (Cell Proliferation Dye, red) from wildtype (WT) and CD103−/− mice (as indicated) were serially studied after overnight incubation by time-lapse imaging using spinning disc microscopy in differential interference contrast (DIC) with an objective lens at 25× magnification. IEL tracks of the entire area (all tracks, left), within IECs (inside tracks, middle), or around IECs (outside tracks, right) are marked in yellow. Scale bar 50 µm. (B) The number of IEL tracks within the subgroups as specified were quantified in IEL-IEC co-cultures with IELs from wildtype and CD103−/− mice, respectively. A track is a contiguous, comprehensible movement of one cell over several frames and is represented by a single yellow line (see Section 4.10). (C) The number of IEL tracks occurring as transition events, i.e., crossing between inside and outside of IEC organoids, was analyzed in IEL-IEC co-cultures with IELs from wildtype and CD103−/− mice, respectively. (D) The mean speed of cells including within the subgroups as specified was calculated in IEL-IEC co-cultures with IELs from wildtype and CD103−/− mice, respectively. (E) The maximum displacement, i.e., mean of the highest 15 track length values per time-lapse movie, was compared in IEL-IEC co-cultures between IELs from wildtype and CD103−/− mice, respectively. Please see Section 4. for the definition of terms and more details on methodology. Co-cultures were incubated overnight before imaging. n = 8–10 per group. All data are representative of at least three independent experiments. * p < 0.05, ** p < 0.01.

