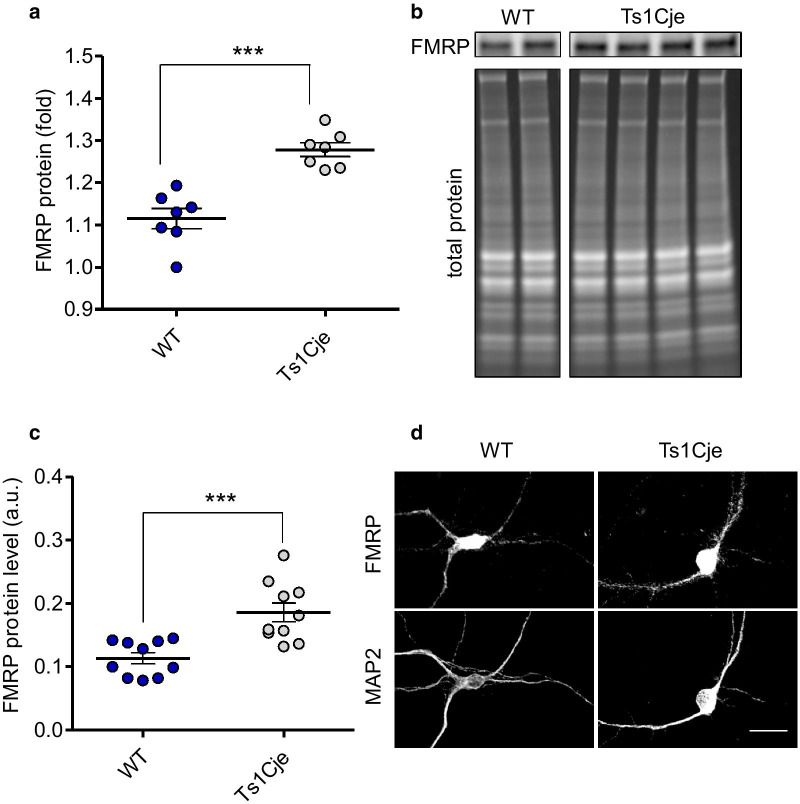
Fig. 5.
Quantification of FMRP protein in WT and Ts1Cje hippocampus. A Hippocampal proteins from WT and Ts1Cje mice pairs were analyzed by Western blots with an anti-FMRP antibody. The signals were normalized to the corresponding total protein loaded and the mean ± SEM values are shown (WT: 1.115 ± 0.0239; Ts1Cje: 1.278 ± 0.0162; p = 0.0006, Mann Whitney test, n = 7 animals per genotype). B Representative Western blot showing two WT and four Ts1Cje littermate pairs (some lanes corresponding to non-littermate animals have been removed, but both WT and Ts1Cje panels correspond to the same Western blot experiment). C Quantification of the relative amount of FMRP protein in dendrites of WT and Ts1Cje hippocampal neurons at DIV14. The mean pixel intensity ± SEM for FMRP immunofluorescence in dendrites is shown in arbitrary units (a.u.) (p = 0.0006, t test, n = 10 images per genotype; each image typically contained one neuron). D Representative gray scale confocal images from the experiment in C, showing FMRP and MAP2 labeling in WT and Ts1Cje neurons. Scale bar = 20 μm. Note that dendritic branching and length are reduced in Ts1Cje neurons, compared to WT controls (unpublished observations)

