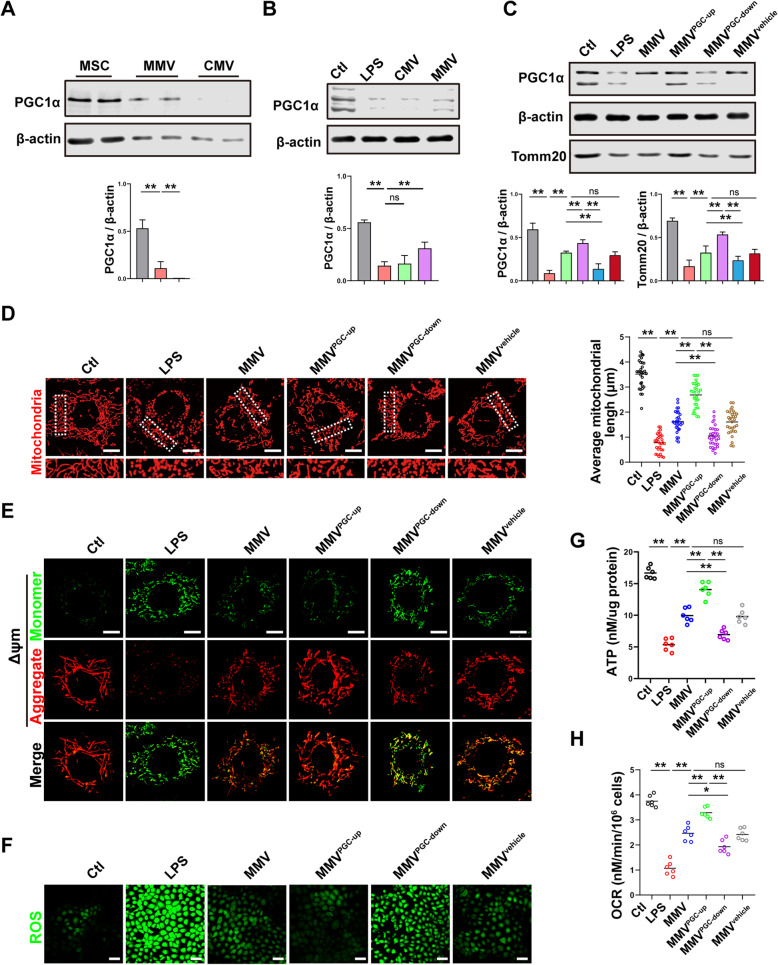
Fig. 7.
MMVs delivered PGC-1α to IEC-6 to improve the mitochondrial function. a The relative expression of PGC-1α in MSCs, MMVs, and CMVs. β-actin was used as the internal reference (n=5). b The relative expression of PGC-1α in IEC-6 treated by MMVs. β-actin was used as the internal reference (n=5). c The relative expression of PGC-1α in IEC-6 treated by modified MMVs. β-actin was used as the internal reference (n=5). d Representative microphotographs of mitochondria treated by modified MMVs and the average mitochondria length in 30 cells. The scale bar represents 10μm. e Representative microphotographs of ΔΨm in IEC-6 treated by modified MMVs. The scale bar represents 10μm. f Representative microphotographs of ROS in IEC-6 treated by modified MMVs. The scale bar represents 50μm. g ATP concentration in IEC-6 treated by modified MMVs (n=6). h OCR in IEC-6 treated by modified MMVs (n=6). Ctl, normal control group; LPS, LPS-stimulated group; CMV, CMV-treated group; MMV, MMV-treated group; MMVPGC-1α-up, PGC-1α upregulation in MMVs; MMVPGC-1α-down, PGC-1α downregulation in MMVs; MMVvehicle, PGC-1α mock-transfection in MMVs. **P < 0.01, *P < 0.05

