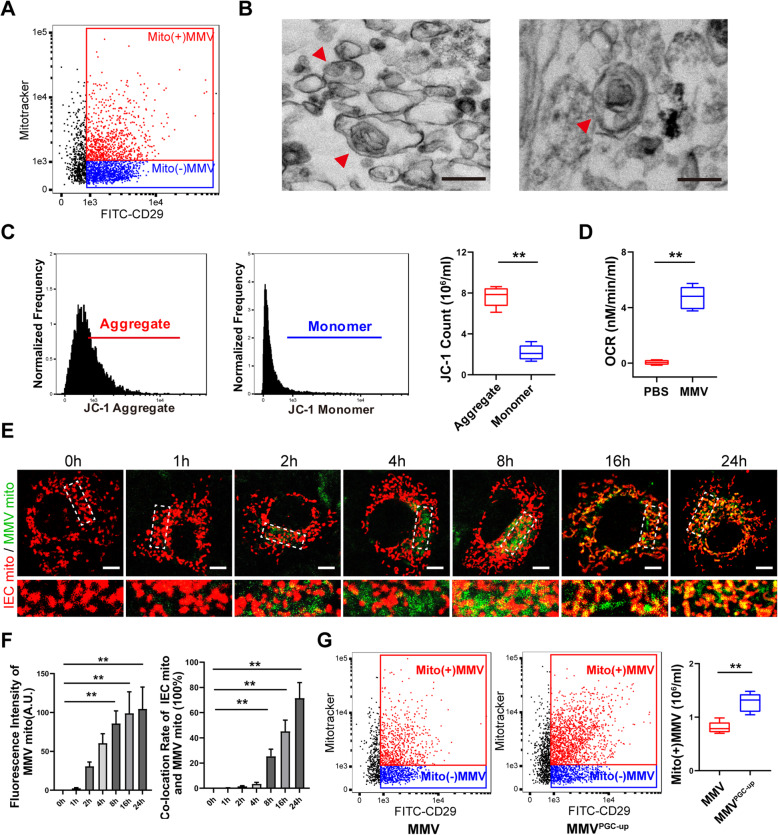
Fig. 9.
MMVs delivered functional mitochondria to IEC-6. a Flow cytometry analysis of mitochondria-positive MMVs detected by mitotracker-Red. b Representative TEM microphotographs of mitochondria-carried MMVs. The scale bar represents 500nm. c Flow cytometry analysis of ΔΨm in MMVs. d OCR analysis in MMVs (n=5). e Representative confocal microphotographs of the fusion of MMV-delivered mitochondria (Green pseudocolor) and the mitochondria in IEC-6 (Red pseudocolor). The scale bar represents 10μm. f The relative fluorescence intensity of MMVs and the co-location rate of two mitochondria in IEC-6 (n=5). g Flow cytometry analysis of mitochondria-positive MMVs in PGC-1α upregulated MMVs (n=5). **P < 0.01

