
Figure 1.
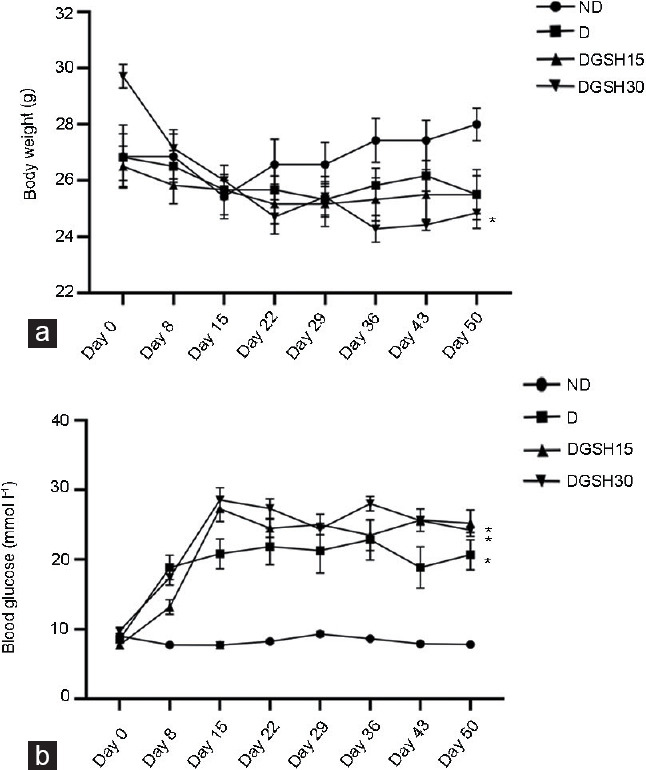
Effect of GSH on (a) body weight and (b) blood glucose level in diabetic mice after 50 days of treatment (n = 6). Values are presented as mean ± s.d. *P < 0.05, the indicated group compared to day 0. ND: nondiabetic control group; D: diabetic control group; DGSH15: diabetic mice treated with GSH at 15 mg kg−1 BW; DGSH30: diabetic mice treated with GSH at 30 mg kg−1 BW; GSH: glutathione; s.d.: standard deviation; BW: body weight.