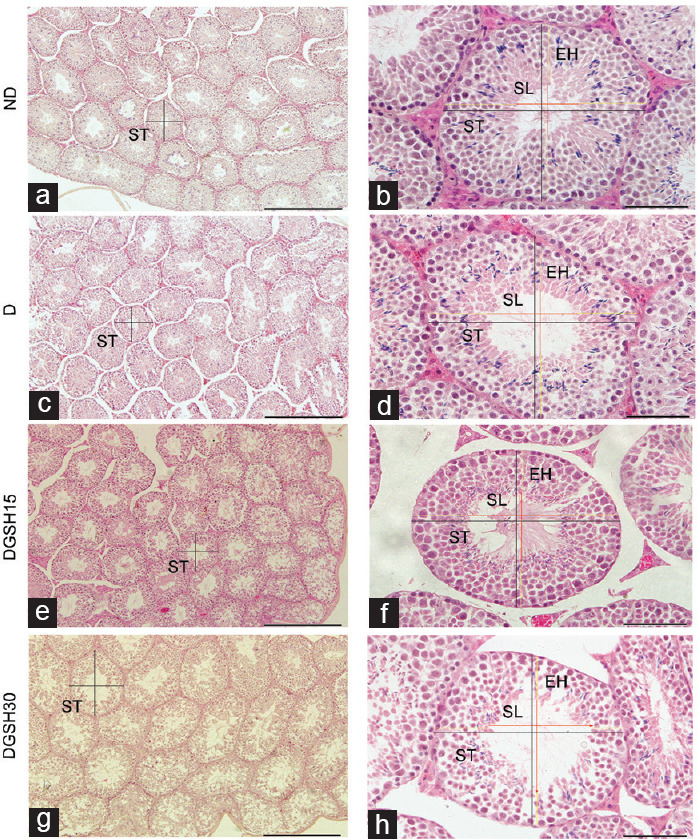
Figure 4.

Effect of exogenous GSH on mice testes after 50 days of treatment (n = 6). Embedded testis tissue blocks were cut into 5-μm sections and stained with H and E. Black lines indicate diameter of seminiferous tubule, red lines indicate diameter of seminiferous lumen, and yellow lines indicate epithelial height of seminiferous tubule. Representative images of testicular morphology at different magnifications. Scale bars in the left column (a, c, e and g) represent 1000 μm, while scale bars in the right column (b, d, f and h) represent 200 μm. ST: seminiferous tubule; SL: seminiferous lumen; EH: epithelial height; ND: nondiabetic control group; D: diabetic control group; DGSH15: diabetic mice treated with GSH at 15 mg kg−1 BW; DGSH30: diabetic mice treated with GSH at 30 mg kg−1 BW; GSH: glutathione; H and E: hematoxylin and eosin; BW: body weight.
