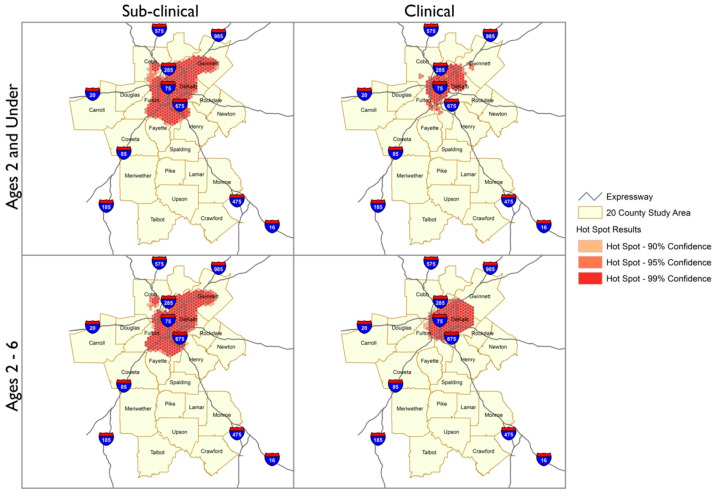
Figure 2.
Comparison of Hotspot Analysis Distribution Patterns between Sub-clinical and Clinical BLLs for the year 2010. Hotspot analysis of the 90–99% confidence regions of hotspots for BLLs 2 to <5 µg/dL (Sub-clinical) and BLLs ≥ 5 µg/dL (Clinical) for 20-county metro Atlanta area in 2010. BLLs 2 to <5 µg/dL and BLLs ≥ 5 µg/dL are shown as red pattern dots with the darkest shaded regions reflecting the 99% confidence area.

